Fig. 5.
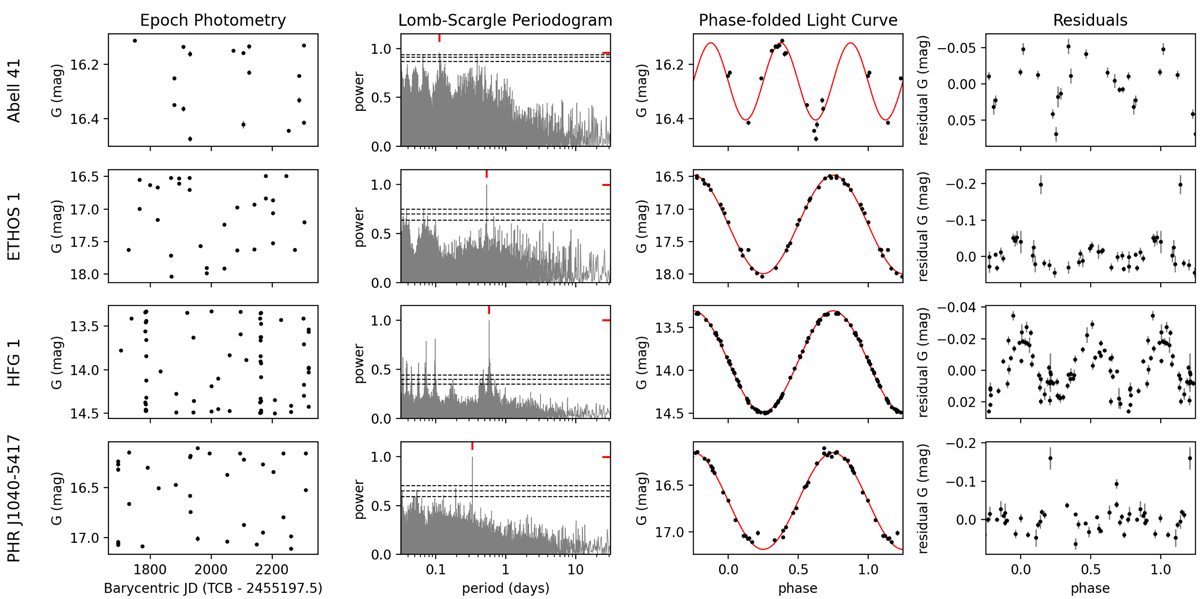
Epoch photometry (left), derived periodograms (left centre), phase-folded light curves (right centre), and residuals (right) for previously known binaries classified as VARIABLE by Gaia. Red ticks on the periodograms indicate the highest peak, and horizontal dashed lines are false-alarm levels at (from low to high) 10%, 1%, and 0.1%. Powers are normalised relative to the residuals of a constant model and lie between 0 (no improvement over constant model) and 1 (periodic model has zero residuals). Error bars are 2σ errors for visibility. An additional half-phase is shown for the light curves and residuals. The light curve and residuals for Abell 41 are folded at double the derived period (see text).
Current usage metrics show cumulative count of Article Views (full-text article views including HTML views, PDF and ePub downloads, according to the available data) and Abstracts Views on Vision4Press platform.
Data correspond to usage on the plateform after 2015. The current usage metrics is available 48-96 hours after online publication and is updated daily on week days.
Initial download of the metrics may take a while.