Fig. 3.
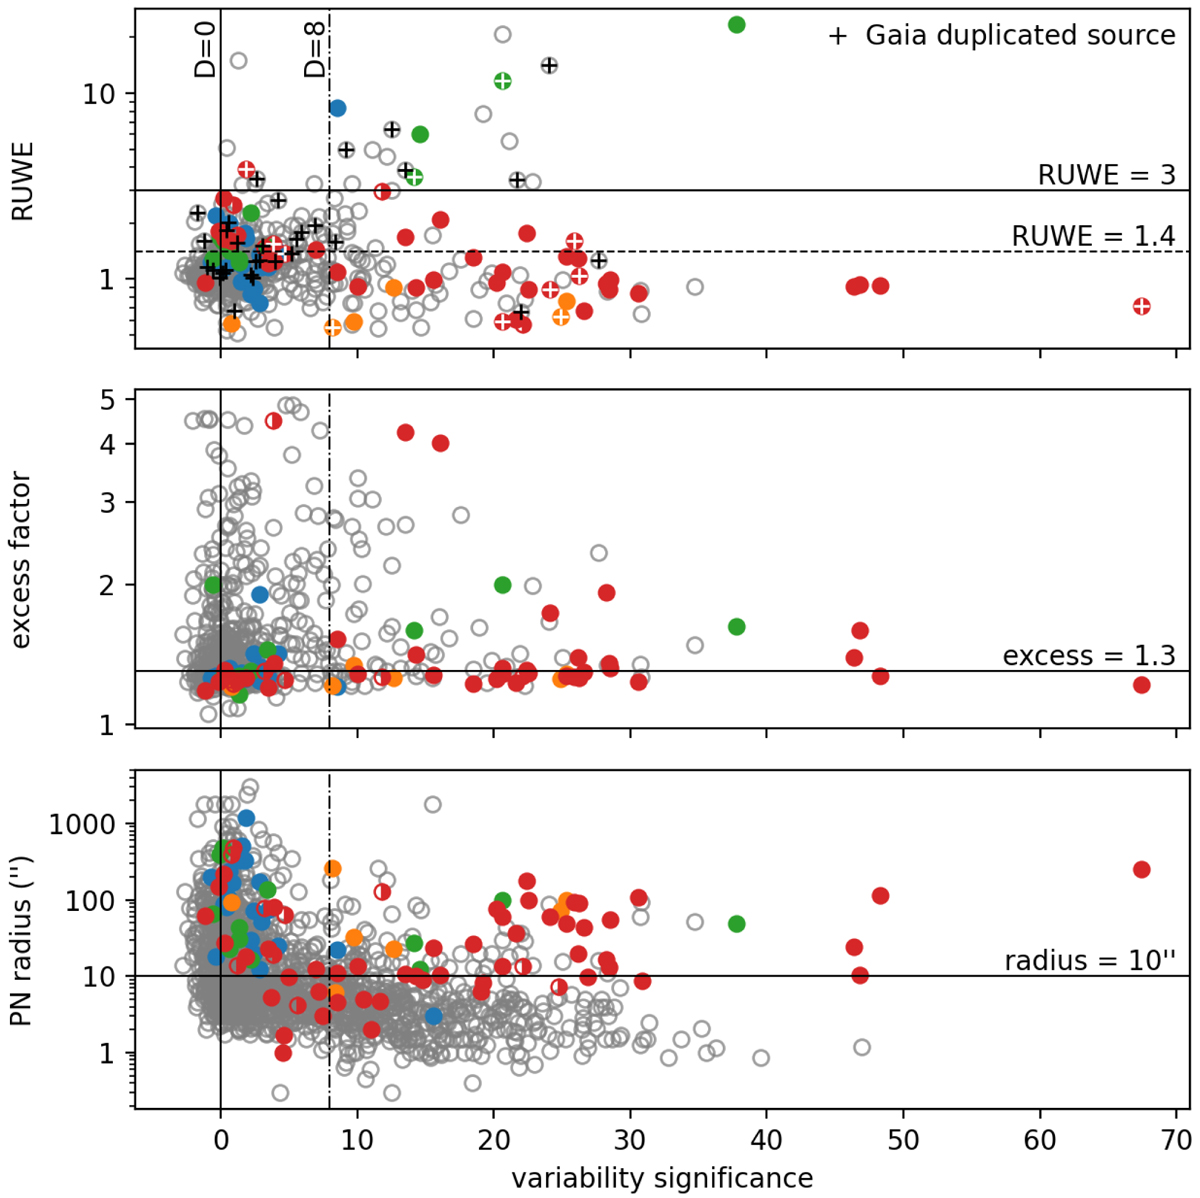
Quantities potentially associated with spurious variability in Gaia photometry. Markers are different binary types as in Fig. 1. Vertical lines correspond to the lines of constant variability significance in Fig. 1. The significance of the horizontal lines is described in the text. Duplicated sources in Gaia are indicated in the upper plot with pluses. PNe in the upper and middle plots are limited to a minimum radius of 10″ (corresponding to the selection in Fig. 1), while the lower plot has no such restriction.
Current usage metrics show cumulative count of Article Views (full-text article views including HTML views, PDF and ePub downloads, according to the available data) and Abstracts Views on Vision4Press platform.
Data correspond to usage on the plateform after 2015. The current usage metrics is available 48-96 hours after online publication and is updated daily on week days.
Initial download of the metrics may take a while.