Fig. 3
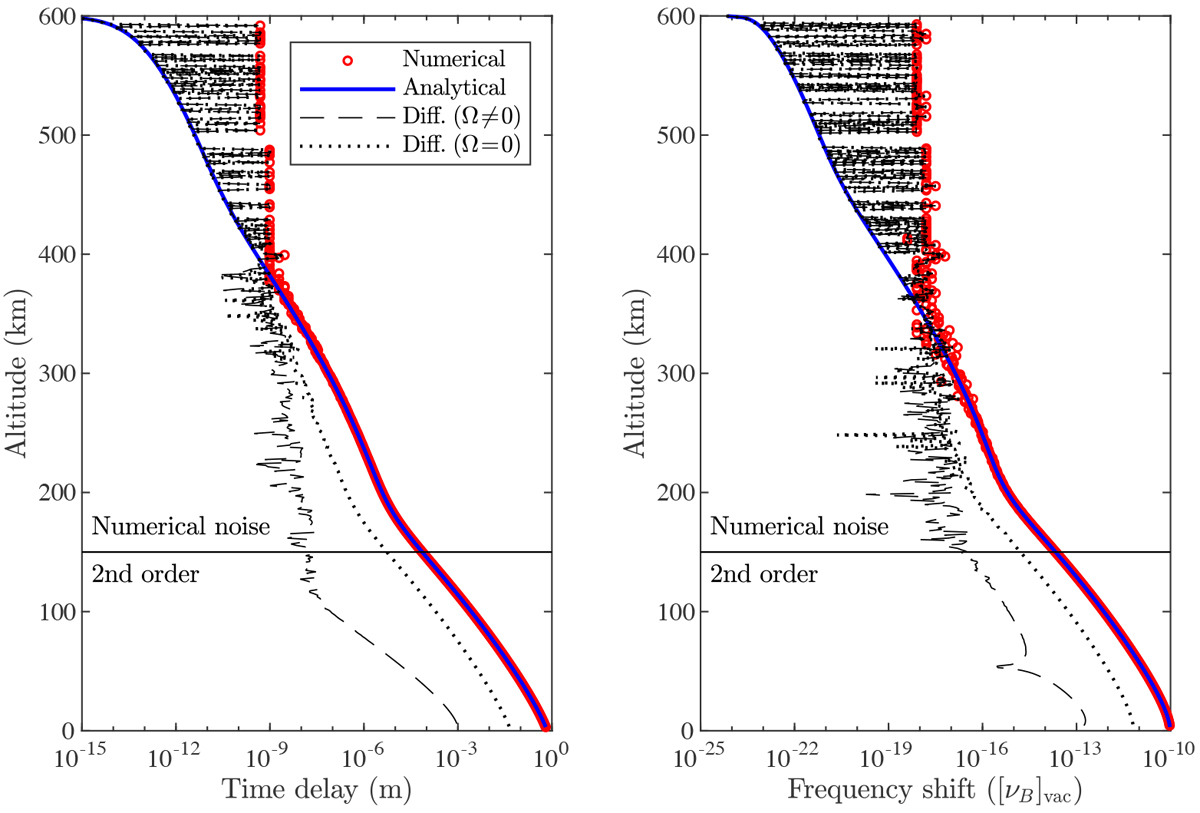
Time delay (left panel) and frequency shift (right panel) due to the atmosphere of the occulting planet for an index of refraction profile given in Eq. (152a) with N0 = 10−6. Red circles represent results of the numerical integration (i.e., ![]() in Eq. (157) for the left panel, and Eq. (158) with
in Eq. (157) for the left panel, and Eq. (158) with ![]() deduced from Eq. (156) for the right panel). The thick blue line corresponds to the analytical predictions (i.e.,
deduced from Eq. (156) for the right panel). The thick blue line corresponds to the analytical predictions (i.e.,
![]() in Eq. (133) for the left panel, and Eq. (158) with
in Eq. (133) for the left panel, and Eq. (158) with ![]() deduced from Eqs. (137), (139), and (146) for the right panel). The dashed lines correspond to the difference between numerical and analytical results. The dotted lines represent the same difference setting Ω = 0 into analytical solutions. Above the horizontal thin black line, the difference between numerical and analytical results is dominated by numerical noise, while below, it is dominated by neglected second-order terms.
deduced from Eqs. (137), (139), and (146) for the right panel). The dashed lines correspond to the difference between numerical and analytical results. The dotted lines represent the same difference setting Ω = 0 into analytical solutions. Above the horizontal thin black line, the difference between numerical and analytical results is dominated by numerical noise, while below, it is dominated by neglected second-order terms.
Current usage metrics show cumulative count of Article Views (full-text article views including HTML views, PDF and ePub downloads, according to the available data) and Abstracts Views on Vision4Press platform.
Data correspond to usage on the plateform after 2015. The current usage metrics is available 48-96 hours after online publication and is updated daily on week days.
Initial download of the metrics may take a while.