Free Access
Fig. 7.
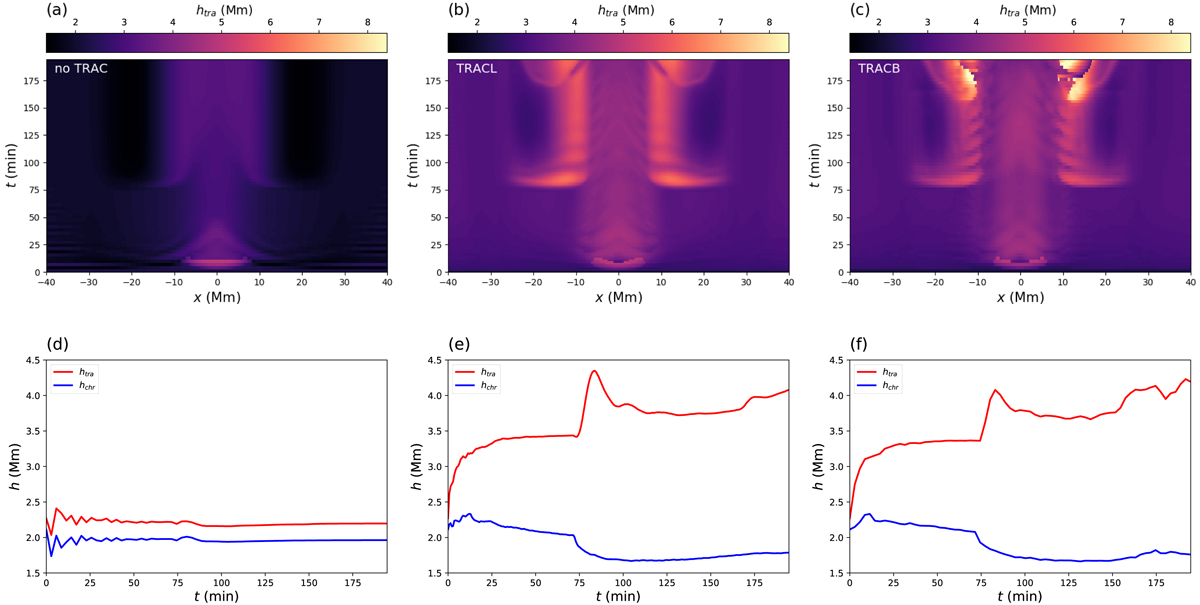
Time evolution of the transition region. Upper panels: time evolution of the height of the transition region htra for different runs: no TRAC (a), TRACL (b), or TRACB (c). Lower panels: time evolution of htra and hchr as averaged along the x direction for the corresponding panels above.
Current usage metrics show cumulative count of Article Views (full-text article views including HTML views, PDF and ePub downloads, according to the available data) and Abstracts Views on Vision4Press platform.
Data correspond to usage on the plateform after 2015. The current usage metrics is available 48-96 hours after online publication and is updated daily on week days.
Initial download of the metrics may take a while.