Free Access
Fig. 3.
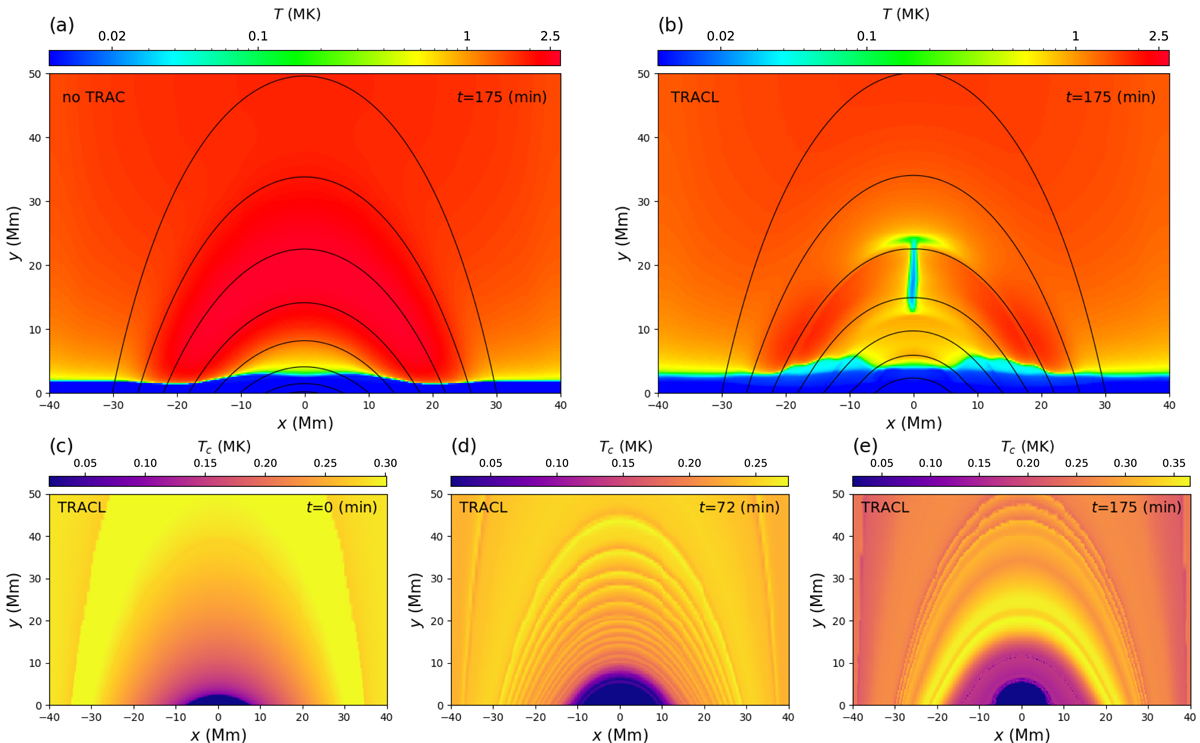
Simulation results of the TRACL method. Upper panels: temperature distributions at t = 175 min for (a) the case without TRAC and (b) with TRACL. Lower panels: Tc distributions for the TRACL case at different times: initially (c), after relaxation, and (d) at the end (e).
Current usage metrics show cumulative count of Article Views (full-text article views including HTML views, PDF and ePub downloads, according to the available data) and Abstracts Views on Vision4Press platform.
Data correspond to usage on the plateform after 2015. The current usage metrics is available 48-96 hours after online publication and is updated daily on week days.
Initial download of the metrics may take a while.