Fig. 2.
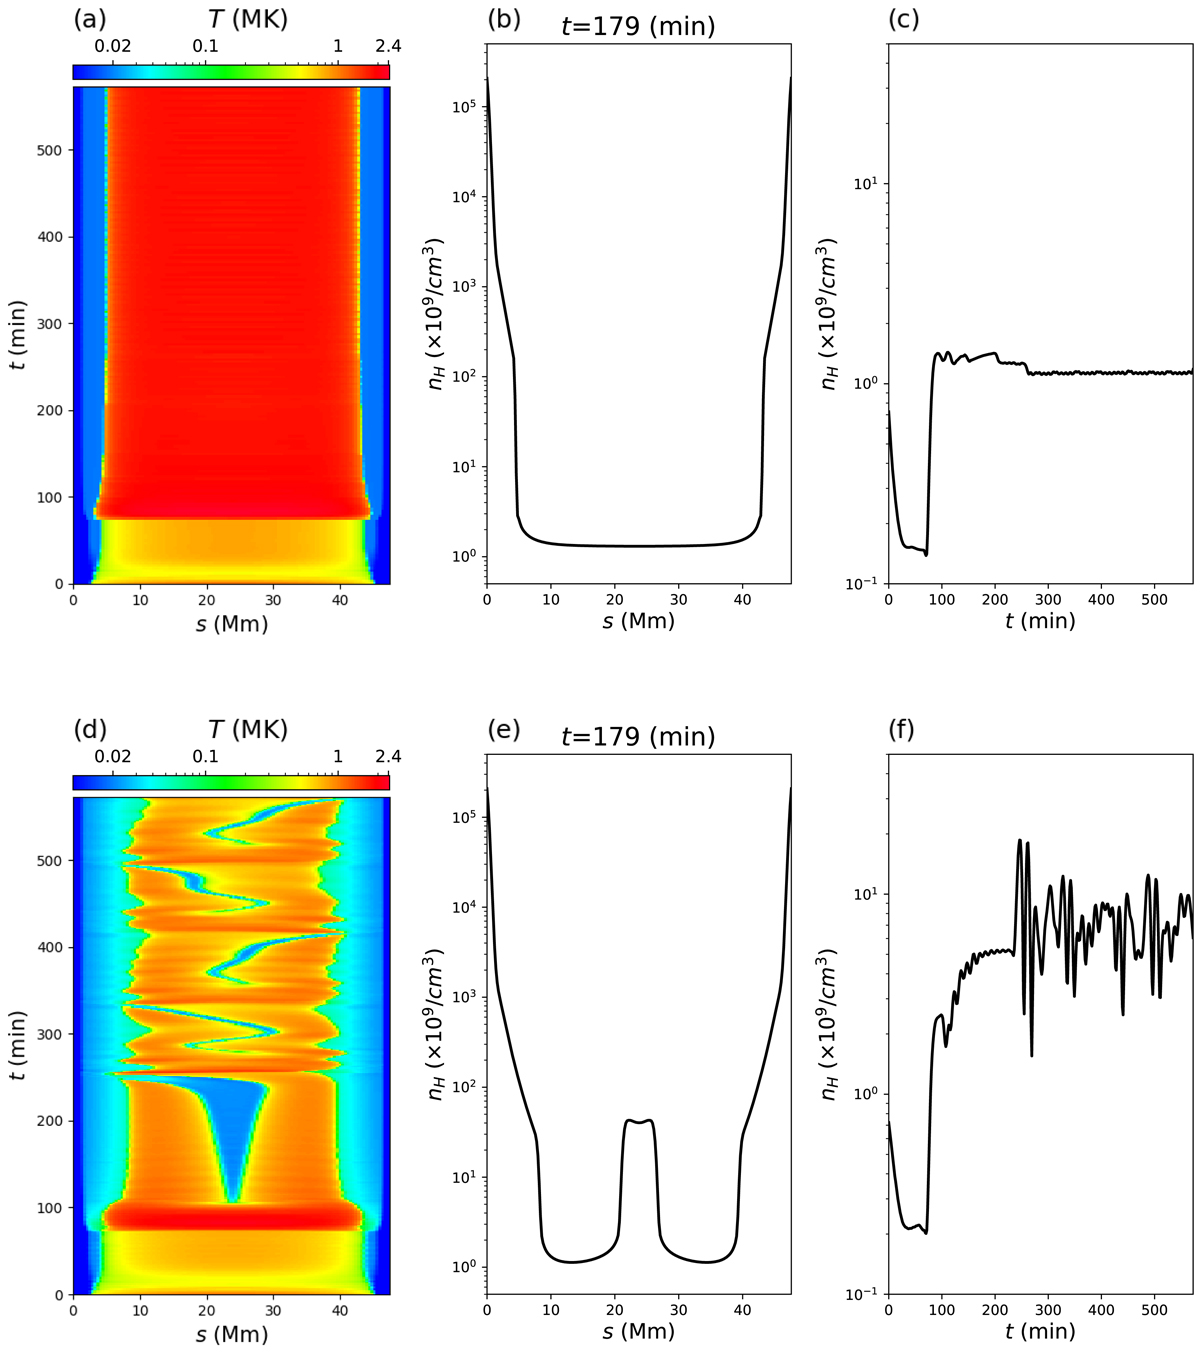
Simulation results of the 1D tests. Left column: temperature evolution of the 1D loop extracted from Fig. 1. Middle column: number density distribution along the loop at t = 179 min. Right column: evolution of the averaged coronal density. The upper panels show results without the TRAC method, and the lower panels show results with the TRAC method.
Current usage metrics show cumulative count of Article Views (full-text article views including HTML views, PDF and ePub downloads, according to the available data) and Abstracts Views on Vision4Press platform.
Data correspond to usage on the plateform after 2015. The current usage metrics is available 48-96 hours after online publication and is updated daily on week days.
Initial download of the metrics may take a while.