Fig. 6.
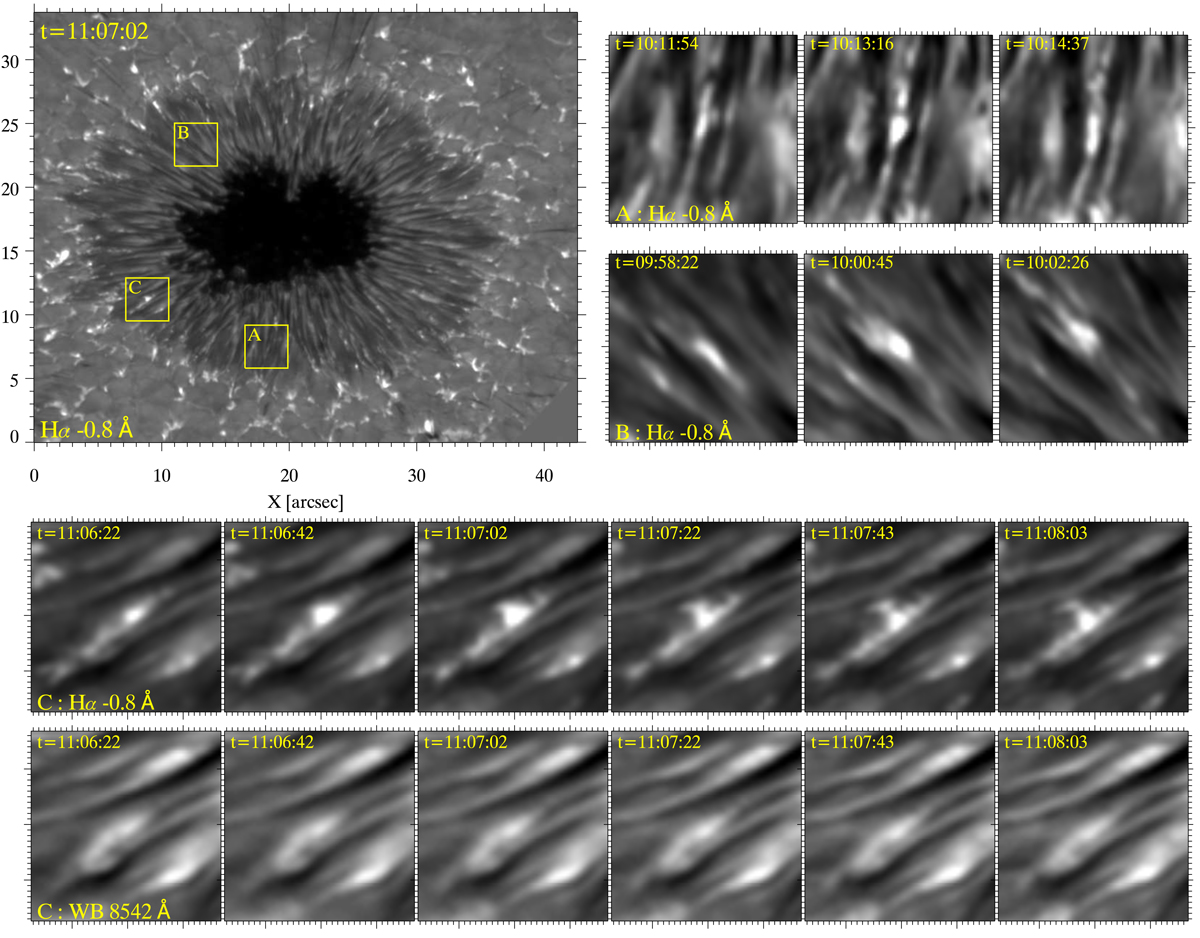
Temporal evolution of PEBs in the sunspot in AR12533 observed on 29 April 2016. The top-left image shows a Hα blue wing image at −0.8 Å with three regions of interest (ROI) marked with labels A, B, and C. The temporal evolution for these ROIs is shown in the rows with smaller Hα wing images, where the time is marked in the top left. The bottom row of images shows the temporal evolution in ROI C in WB 8542 Å for comparison. The spacing between the large ticks in the ROI images is 1″. The contrast in the top-left overview image is enhanced by applying a gamma correction with Γ = 2; all other images have linear scaling on a common scale for each ROI. Three animations associated to this figure are available online: a movie of the sunspot in the Hα blue wing as in the top-left panel, the corresponding movie in WB 8542 Å, and a combined movie showing the left part of the sunspot.
Current usage metrics show cumulative count of Article Views (full-text article views including HTML views, PDF and ePub downloads, according to the available data) and Abstracts Views on Vision4Press platform.
Data correspond to usage on the plateform after 2015. The current usage metrics is available 48-96 hours after online publication and is updated daily on week days.
Initial download of the metrics may take a while.