Fig. 5.
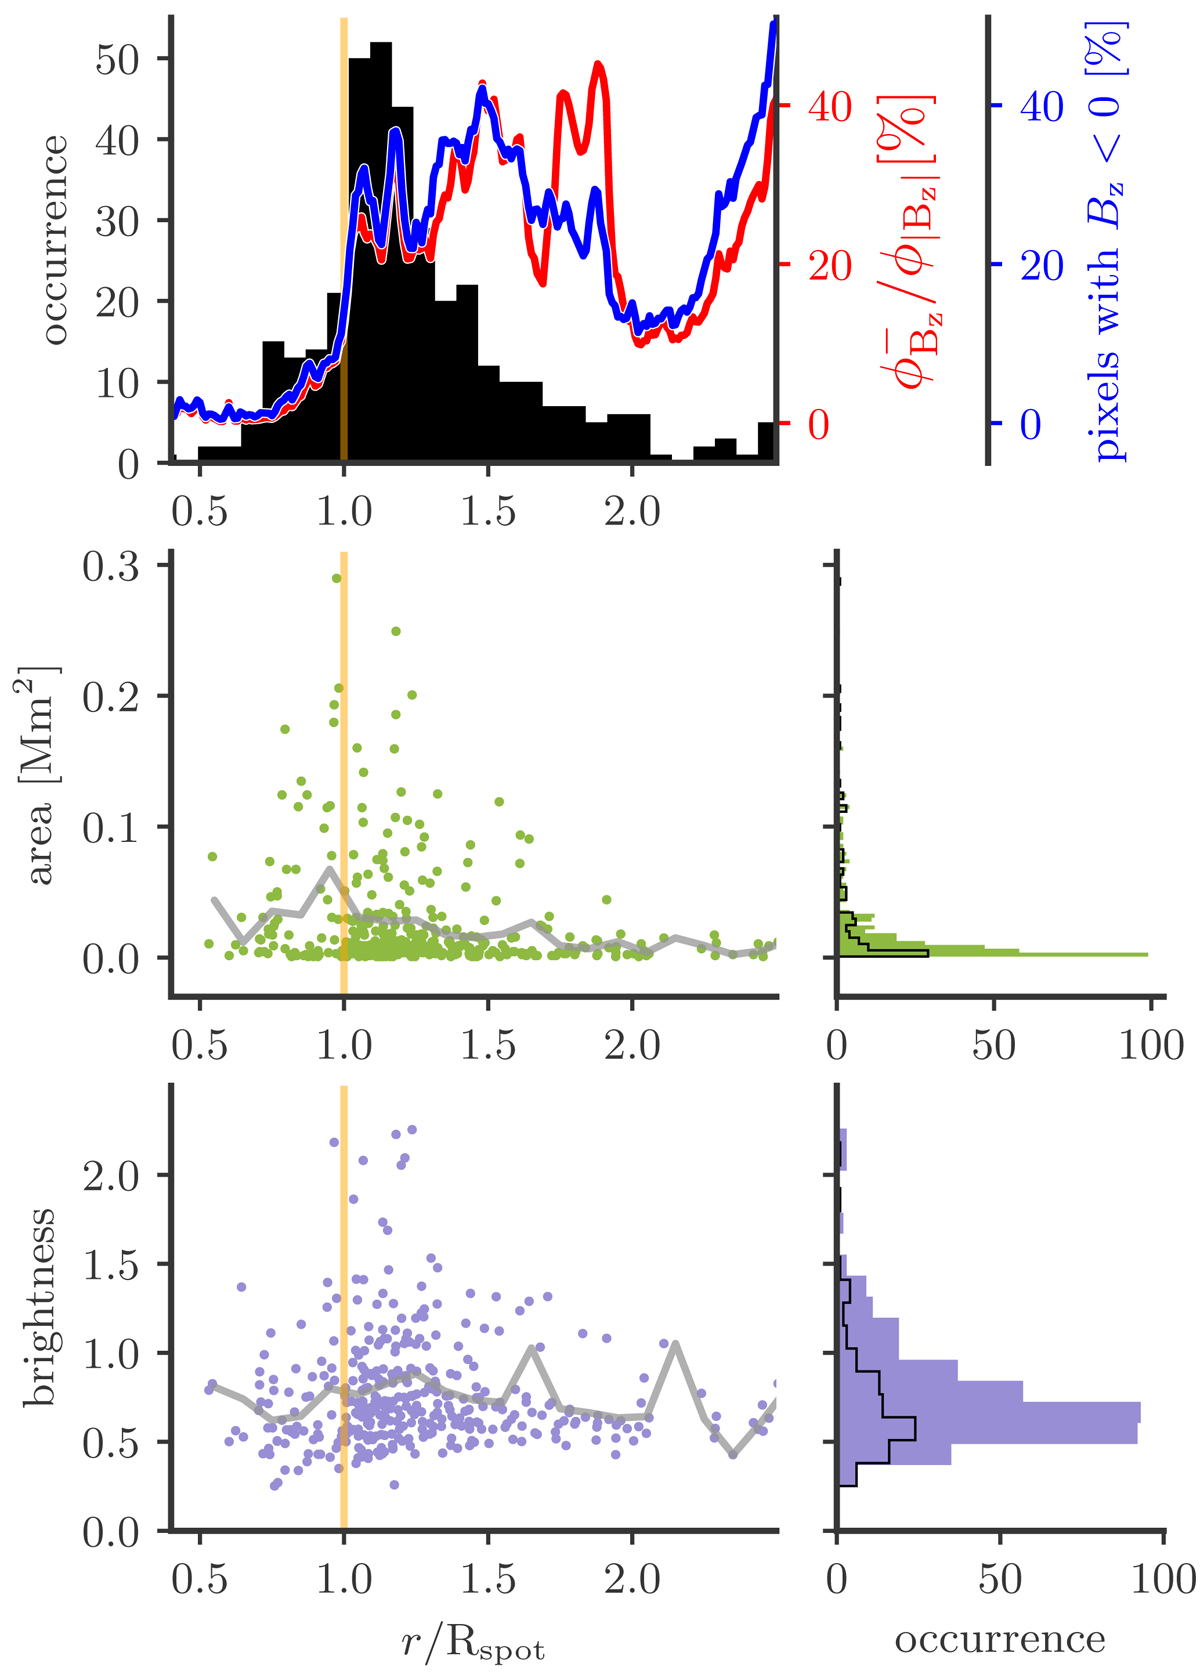
Distribution of EBs and their properties with respect to radial distance from the sunspot center (observed on 22 September 2017). The outer sunspot boundary is at r/Rspot = 1 and is marked by the yellow vertical line (see also the contours in Fig. 4). The statistics are based on k-means detections, the total number of EB detections is 372, of which 108 are PEBs. Top panel: EB occurrence. The red curve shows the ratio of negative magnetic polarity flux relative to total absolute flux (the sunspot is dominated by positive polarity). The blue curve shows the fraction of pixels with negative polarity relative to all pixels with significant magnetic signal (|Bz|> 50 G). Middle panels: area of the EB detections. Bottom panels: Hβ wing brightness enhancement of the brightest pixel in the EB detection relative to the local background in a 100 × 100 pixel area and excluding EB detection pixels. The brightness enhancement is relative to the outermost wavelength positions on both sides of the line center of the background Hβ profile, and on a scaling set by the normalized quiet Sun reference profile. For the two bottom rows, the right panels show occurrence histograms with the black line outlining the histograms for PEBs. The histogram bin size is 0.003 Mm2 in area and 0.12 in brightness enhancement. The gray lines in the left panels mark the average values for each radial distance r/Rspot.
Current usage metrics show cumulative count of Article Views (full-text article views including HTML views, PDF and ePub downloads, according to the available data) and Abstracts Views on Vision4Press platform.
Data correspond to usage on the plateform after 2015. The current usage metrics is available 48-96 hours after online publication and is updated daily on week days.
Initial download of the metrics may take a while.