Fig. 4.
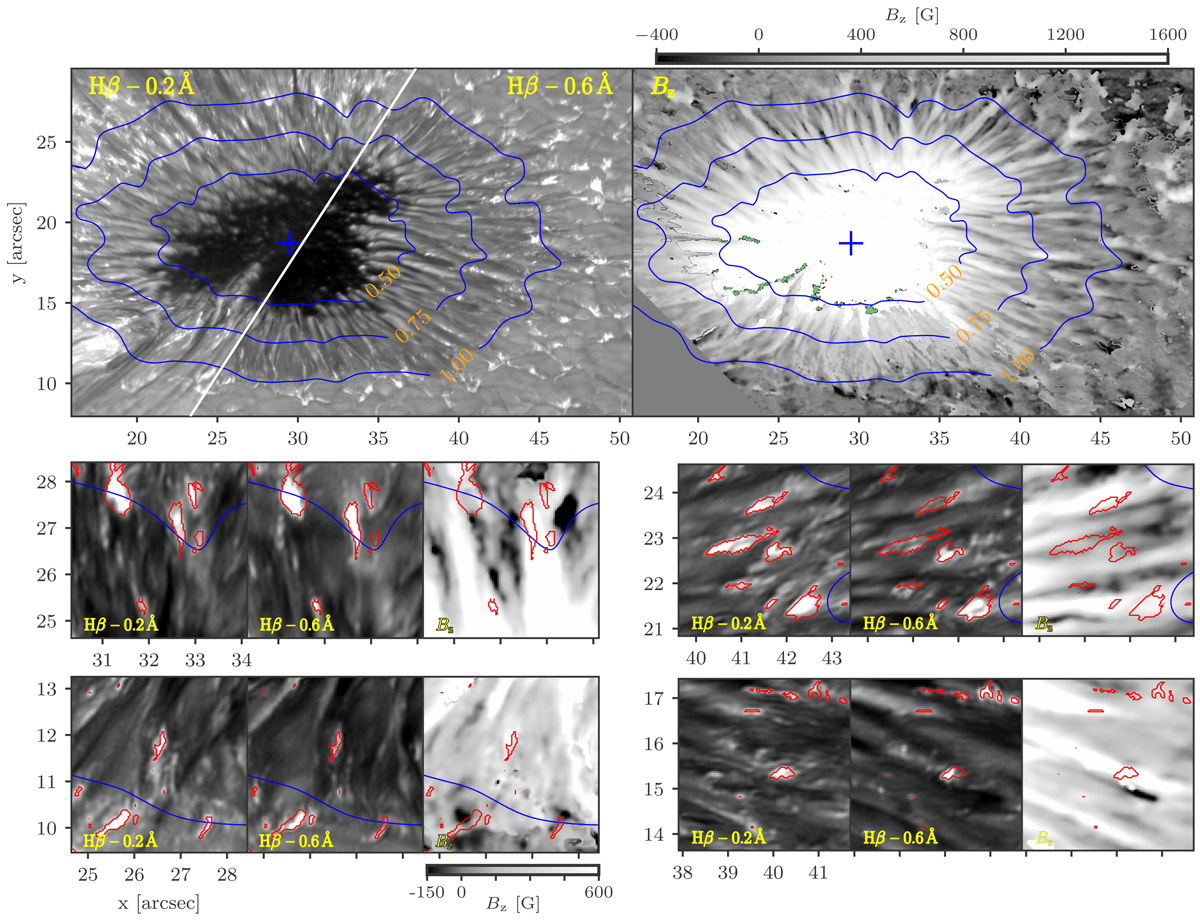
Location of PEBs compared to the vertical magnetic field Bz. The top-left panel shows a split image of the sunspot observed on 22 September 2017, with the left part in the Hβ blue wing at −0.2 Å offset and the right part at −0.6 Å. The blue contours indicate the radial distance r/Rspot to the umbral center that is marked with the blue cross. The contour for r/Rspot = 1.00 is the outer penumbra boundary, defined from the associated WB image. The top-right panel shows the Bz map, derived from ME inversions of the Fe I lines, scaled between −400 and +1600 G. Regions with artifacts due to the de-projection method are marked in green. The sets of panels at the bottom show four ROIs in Hβ −0.2 Å, −0.6 Å, and Bz, respectively. Red contours outline PEBs detected through the k-means method.
Current usage metrics show cumulative count of Article Views (full-text article views including HTML views, PDF and ePub downloads, according to the available data) and Abstracts Views on Vision4Press platform.
Data correspond to usage on the plateform after 2015. The current usage metrics is available 48-96 hours after online publication and is updated daily on week days.
Initial download of the metrics may take a while.