Fig. 3.
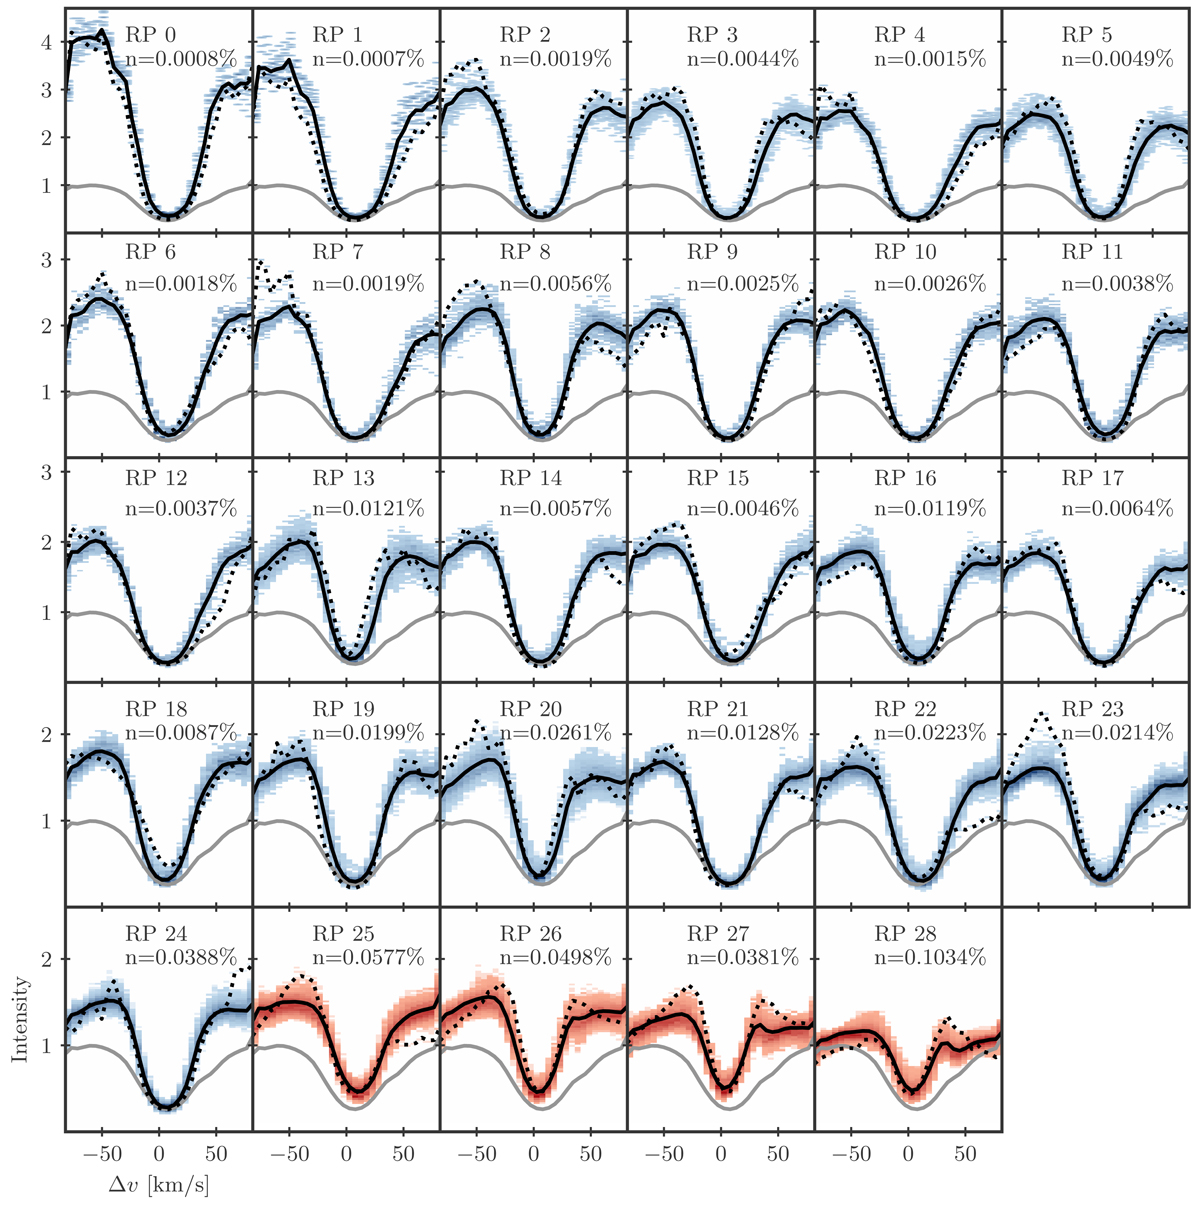
Twenty-nine RPs from the k-means clustering of the Hβ line that are identified as a signature of EB. The black lines show RPs, whereas shaded colored areas represent the density distribution of Hβ spectra within a cluster; darker shades indicate a higher density. Within a particular cluster, the Hβ profile that is farthest (measured in euclidean distance) from the corresponding RPs is shown by the black dotted line. As reference, the average quiet Sun profile (gray line) is plotted in each panel. RPs 0–24 show the typical EB-like Hβ profiles, that is, enhanced wings and unaffected line core, while RPs 25–28 display both an enhancement in the wings as well as in the line core. The parameter n represents the number of pixels in a cluster as percentage of the total of ∼1.73 × 106 pixels.
Current usage metrics show cumulative count of Article Views (full-text article views including HTML views, PDF and ePub downloads, according to the available data) and Abstracts Views on Vision4Press platform.
Data correspond to usage on the plateform after 2015. The current usage metrics is available 48-96 hours after online publication and is updated daily on week days.
Initial download of the metrics may take a while.