Fig. 2.
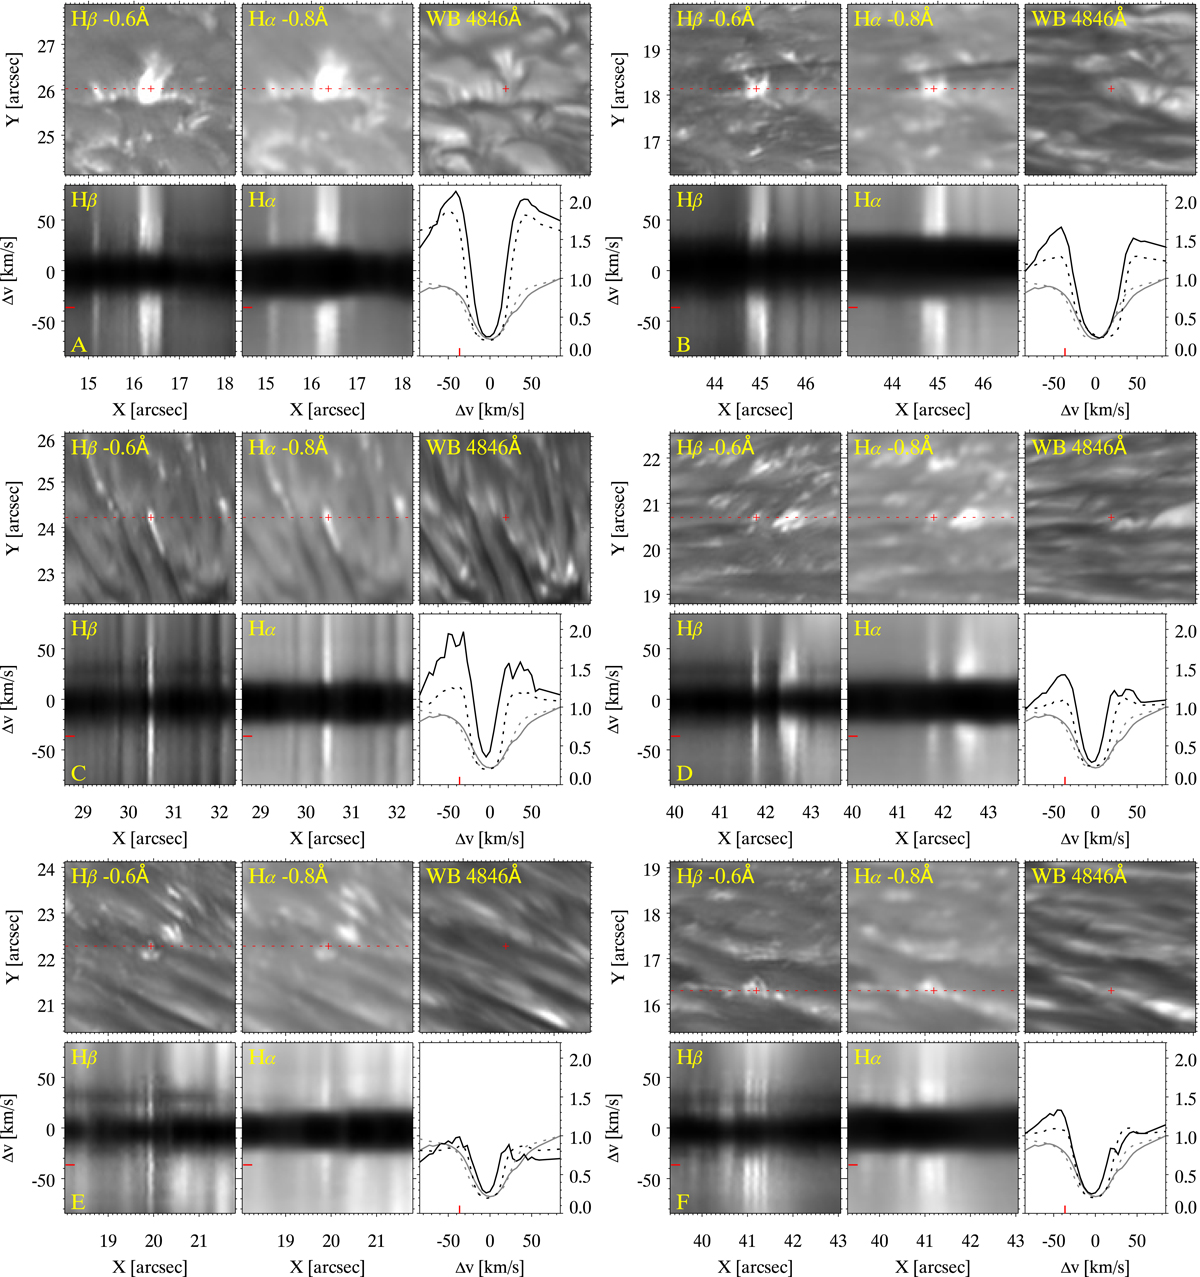
Details of EBs in and outside the penumbra of the sunspot shown in Fig. 1 in six ROIs. The spatial X, Y coordinates are at the same scale as Fig. 1. The top row of panels for each ROI shows Hβ and Hα blue wing and CHROMIS WB 4846 Å images. The bottom-left panels show λx-diagrams of the spectral profiles along the red dotted line in the panels above. The bottom-right panel shows spectral profiles for Hβ (solid black line) and Hα (dashed line) from the position of the red cross in the top-left panels. The thin gray profiles are references to spectral profiles averaged over an area outside the sunspot. The intensity scaling is normalized to the level of the far red wing of the reference profile. The red tick in the bottom row panels indicates the line position of the wing images in the top left. ROI A is centered on a strong EB outside the sunspot. ROI B is centered on an EB at the outer edge of the penumbra. All other examples are PEBs inside the penumbra.
Current usage metrics show cumulative count of Article Views (full-text article views including HTML views, PDF and ePub downloads, according to the available data) and Abstracts Views on Vision4Press platform.
Data correspond to usage on the plateform after 2015. The current usage metrics is available 48-96 hours after online publication and is updated daily on week days.
Initial download of the metrics may take a while.