Fig. 5.
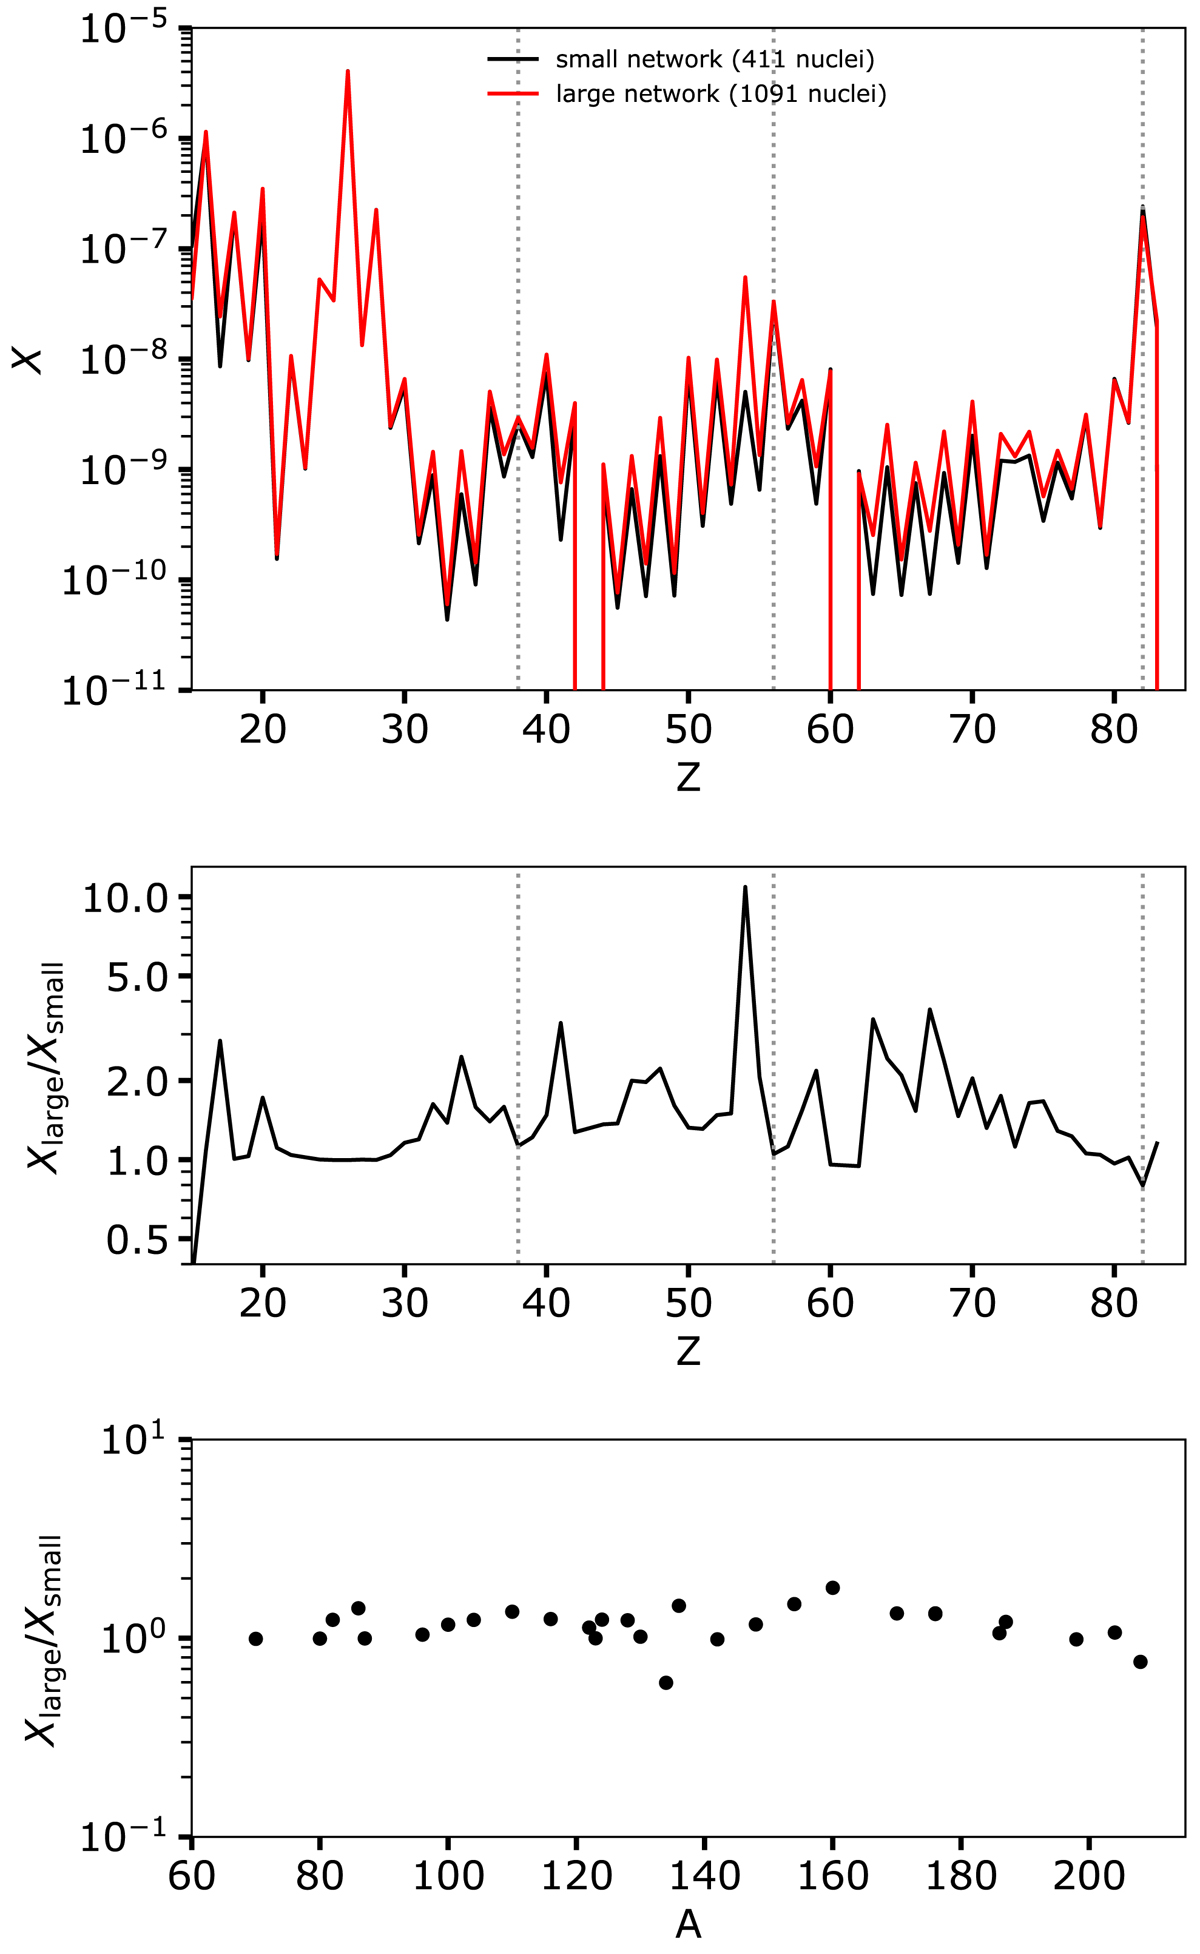
Comparison of the surface abundances after the main proton ingestion using the small and large networks (411 and 1091 species, respectively). Top panel: elemental surface mass fractions as a function of the atomic number. Middle panel: ratios of the elemental mass fraction obtained with the small and large networks, as shown on the top panel. Bottom panel: ratio of the isotopic mass fractions obtained with both networks for s-only nuclei as a function of the atomic mass A.
Current usage metrics show cumulative count of Article Views (full-text article views including HTML views, PDF and ePub downloads, according to the available data) and Abstracts Views on Vision4Press platform.
Data correspond to usage on the plateform after 2015. The current usage metrics is available 48-96 hours after online publication and is updated daily on week days.
Initial download of the metrics may take a while.