Fig. 3.
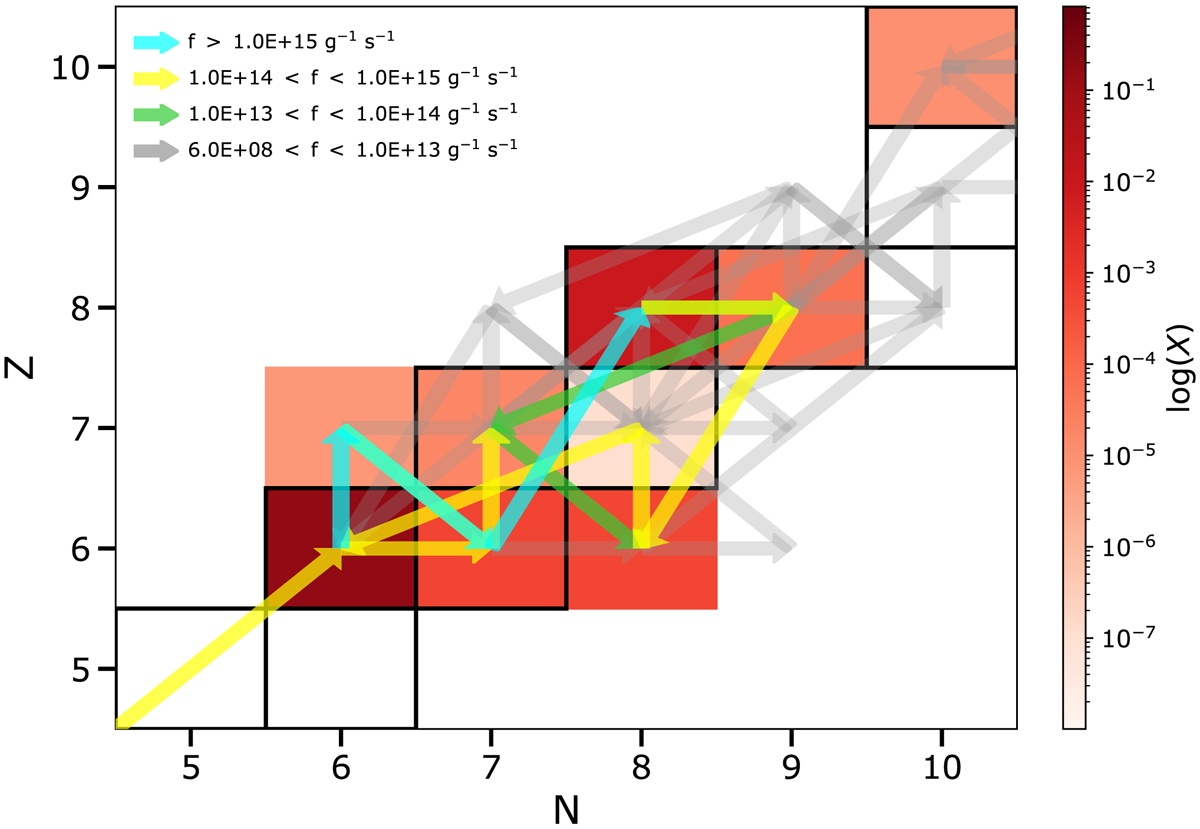
Fluxes f during the main proton ingestion event, at the bottom of the convective pulse, when the neutron density is maximal (red point in the top panel of Fig. 2). The fluxes are defined as f = NavρYiYj⟨σv⟩ (where Yi and Yj are the molar mass fractions of the target and projectile, respectively, Nav the Avogadro number and ⟨σv⟩ the nuclear reaction rate). The colors of the arrow identify various reaction fluxes. The isotopes mass fractions are color-coded according to the right sidebar. The black squares denote stable isotopes.
Current usage metrics show cumulative count of Article Views (full-text article views including HTML views, PDF and ePub downloads, according to the available data) and Abstracts Views on Vision4Press platform.
Data correspond to usage on the plateform after 2015. The current usage metrics is available 48-96 hours after online publication and is updated daily on week days.
Initial download of the metrics may take a while.