Fig. 2.
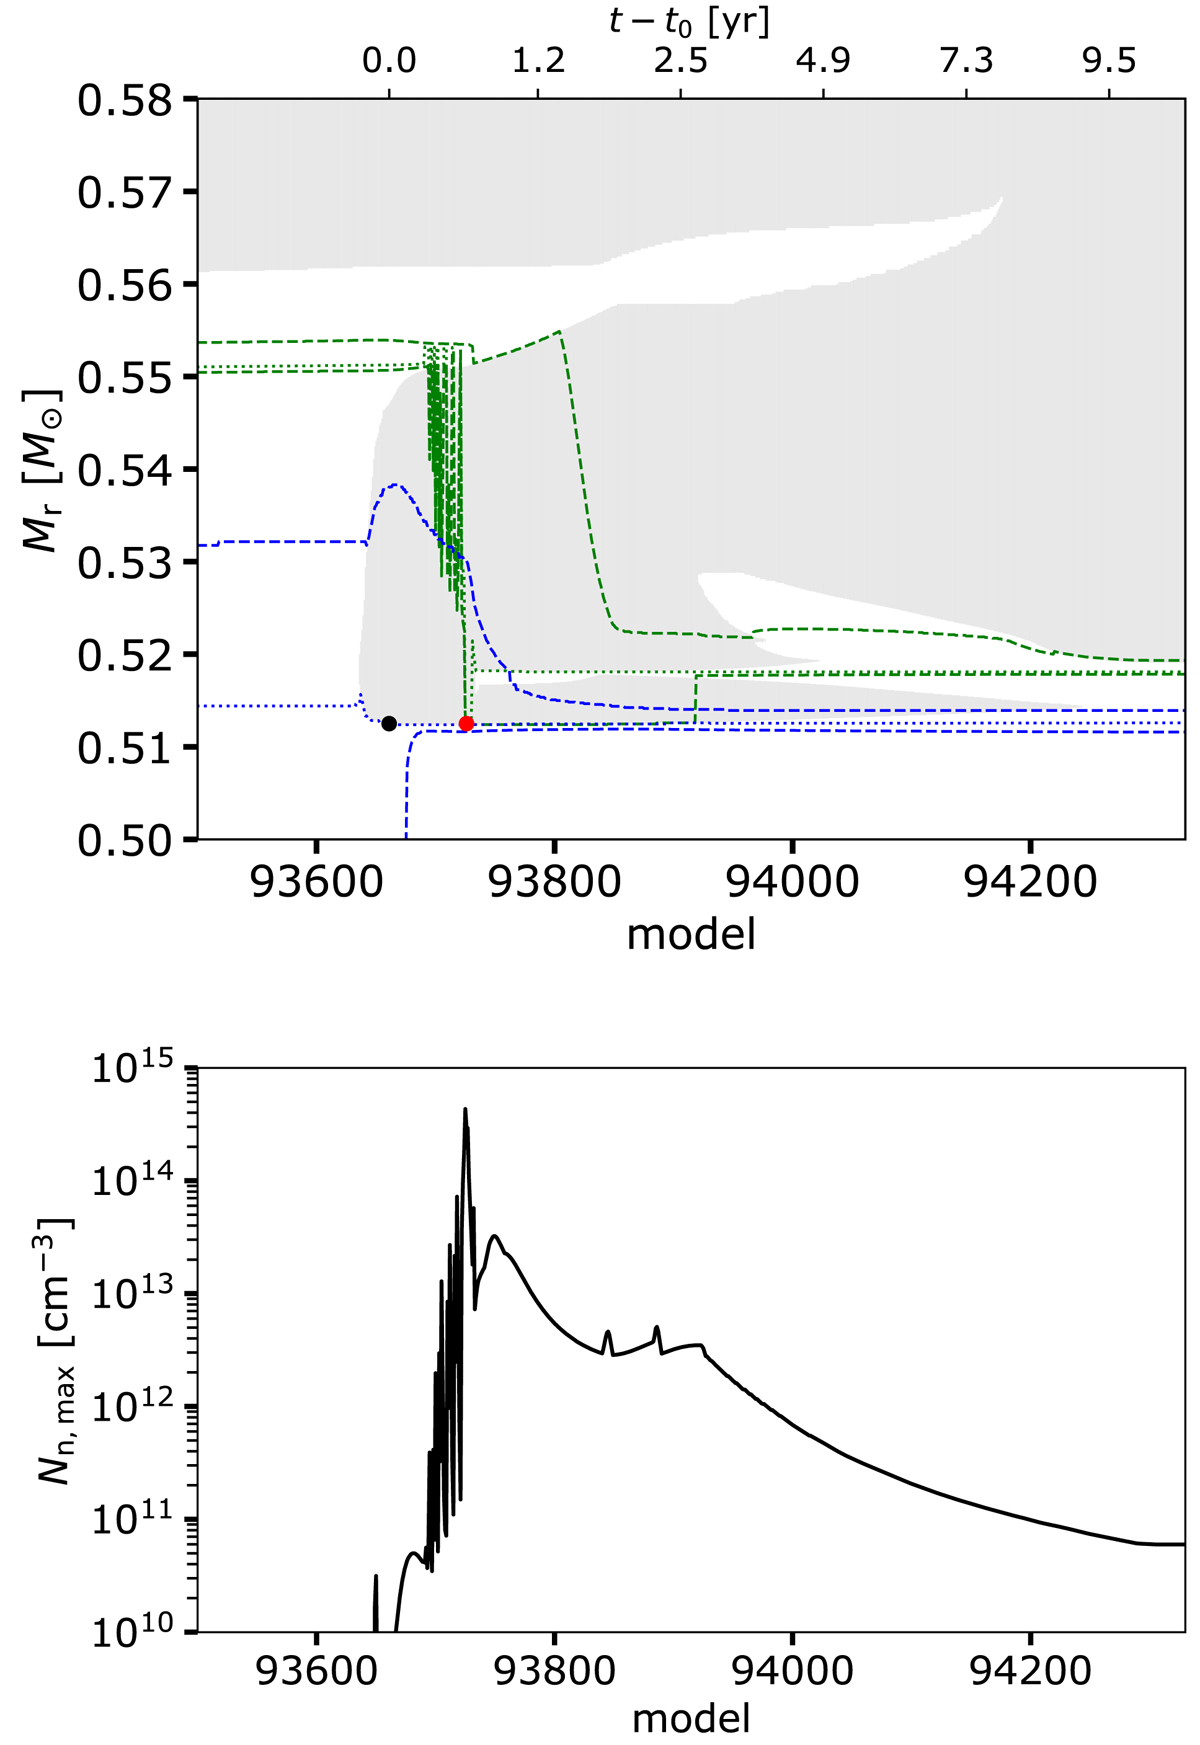
Structure and maximum neutron density during the third instability. Top: Kippenhahn diagram of the same model as in Fig. 1 around the proton ingestion event. The red circle corresponds to the time and location where the neutron density is maximal. The chemical composition at the time and location of the two colored circles are shown in Fig. 4. The time is indicated at specific moments (it does not run linearly) on the top axis, counted from t0, which is the time corresponding to the black circle. The three important steps in this event are the maximal neutron density (red circle, t − t0 = 1.182 yr), the splitting of the convective helium shell (t − t0 = 1.184 yr) and the merging of the helium shell with the envelope (t − t0 = 7.956 yr). Bottom: evolution of maximum neutron density found in the stellar model at a given time (or equivalently for a given evolutionary model number).
Current usage metrics show cumulative count of Article Views (full-text article views including HTML views, PDF and ePub downloads, according to the available data) and Abstracts Views on Vision4Press platform.
Data correspond to usage on the plateform after 2015. The current usage metrics is available 48-96 hours after online publication and is updated daily on week days.
Initial download of the metrics may take a while.