Fig. 11.
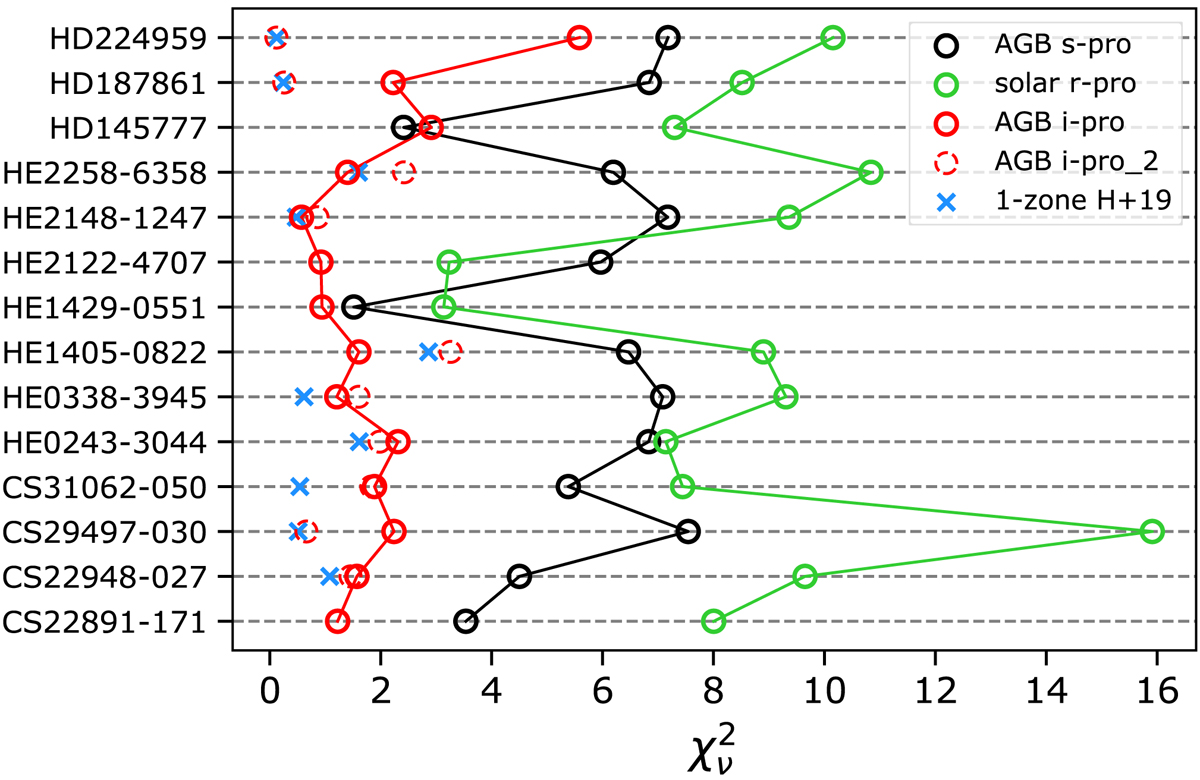
Reduced χ-square values ![]() of the 14 selected r/s-stars. The red, black, and green patterns show the minimum
of the 14 selected r/s-stars. The red, black, and green patterns show the minimum ![]() values obtained with our reference i-process AGB model, a 2 M⊙ [Fe/H] = −2.5 AGB model experiencing s-process and the solar scaled r-process from Arnould et al. (2007), respectively (see text for details). The blue crosses show the
values obtained with our reference i-process AGB model, a 2 M⊙ [Fe/H] = −2.5 AGB model experiencing s-process and the solar scaled r-process from Arnould et al. (2007), respectively (see text for details). The blue crosses show the ![]() values obtained with the one-zone model of Hampel et al. (2019). The dashed red circles show the results obtained with our reference i-process AGB model, but with the same abundance data and uncertainties as in Hampel et al. (2019, see text for details).
values obtained with the one-zone model of Hampel et al. (2019). The dashed red circles show the results obtained with our reference i-process AGB model, but with the same abundance data and uncertainties as in Hampel et al. (2019, see text for details).
Current usage metrics show cumulative count of Article Views (full-text article views including HTML views, PDF and ePub downloads, according to the available data) and Abstracts Views on Vision4Press platform.
Data correspond to usage on the plateform after 2015. The current usage metrics is available 48-96 hours after online publication and is updated daily on week days.
Initial download of the metrics may take a while.