Fig. 1.
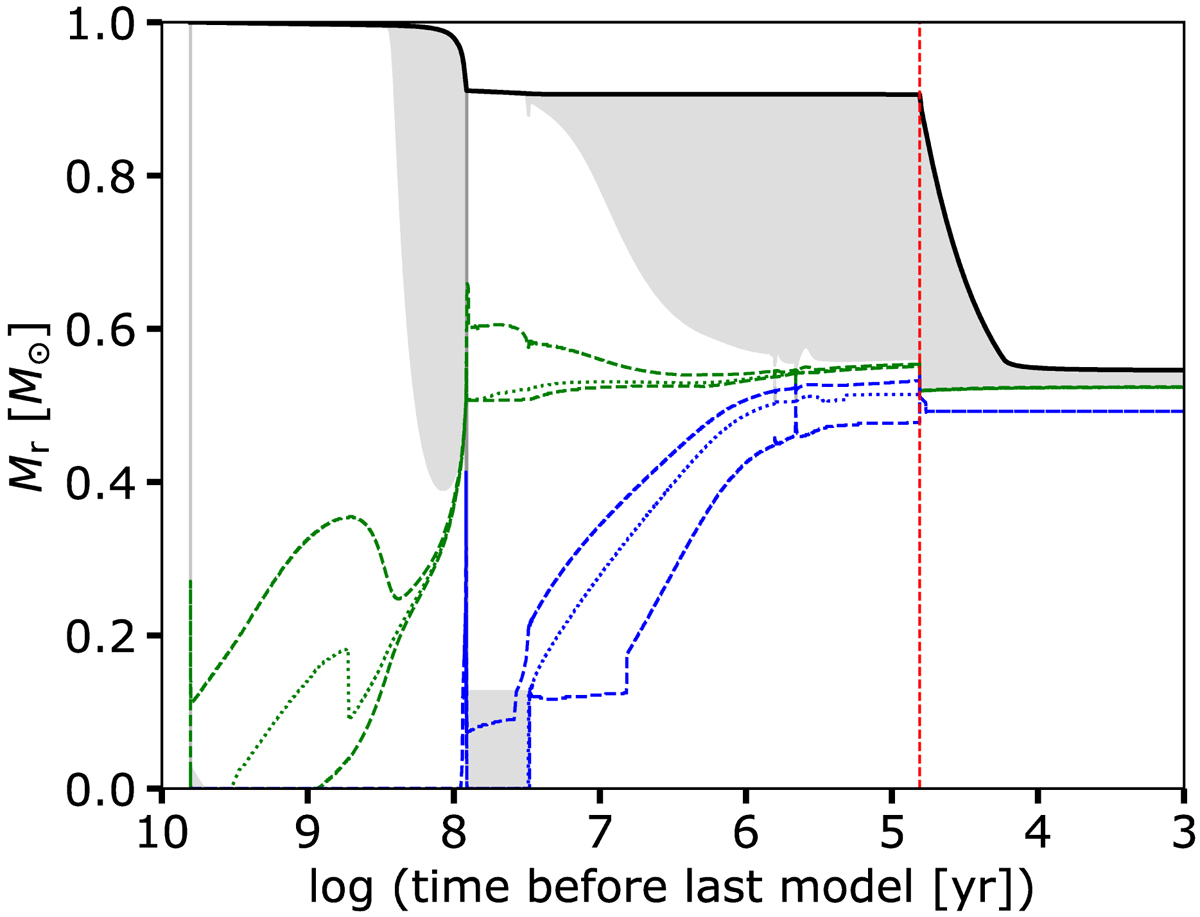
Kippenhahn diagram of the 1 M⊙ stellar model at [Fe/H] = −2.5 discussed in this paper. Time is counted backward from the last computed model. Convective regions are shaded gray. The vertical dashed red line indicates when the main proton ingestion event takes place (during the third thermal pulse). The dotted green and blue lines correspond to the maximum nuclear energy production by hydrogen and helium burning, respectively. The dashed green and blue lines delineate the hydrogen and helium-burning zones; more specifically they outline the zones in which the production of energy by hydrogen or helium burning exceeds 10 erg g−1 s−1.
Current usage metrics show cumulative count of Article Views (full-text article views including HTML views, PDF and ePub downloads, according to the available data) and Abstracts Views on Vision4Press platform.
Data correspond to usage on the plateform after 2015. The current usage metrics is available 48-96 hours after online publication and is updated daily on week days.
Initial download of the metrics may take a while.