Fig. 8
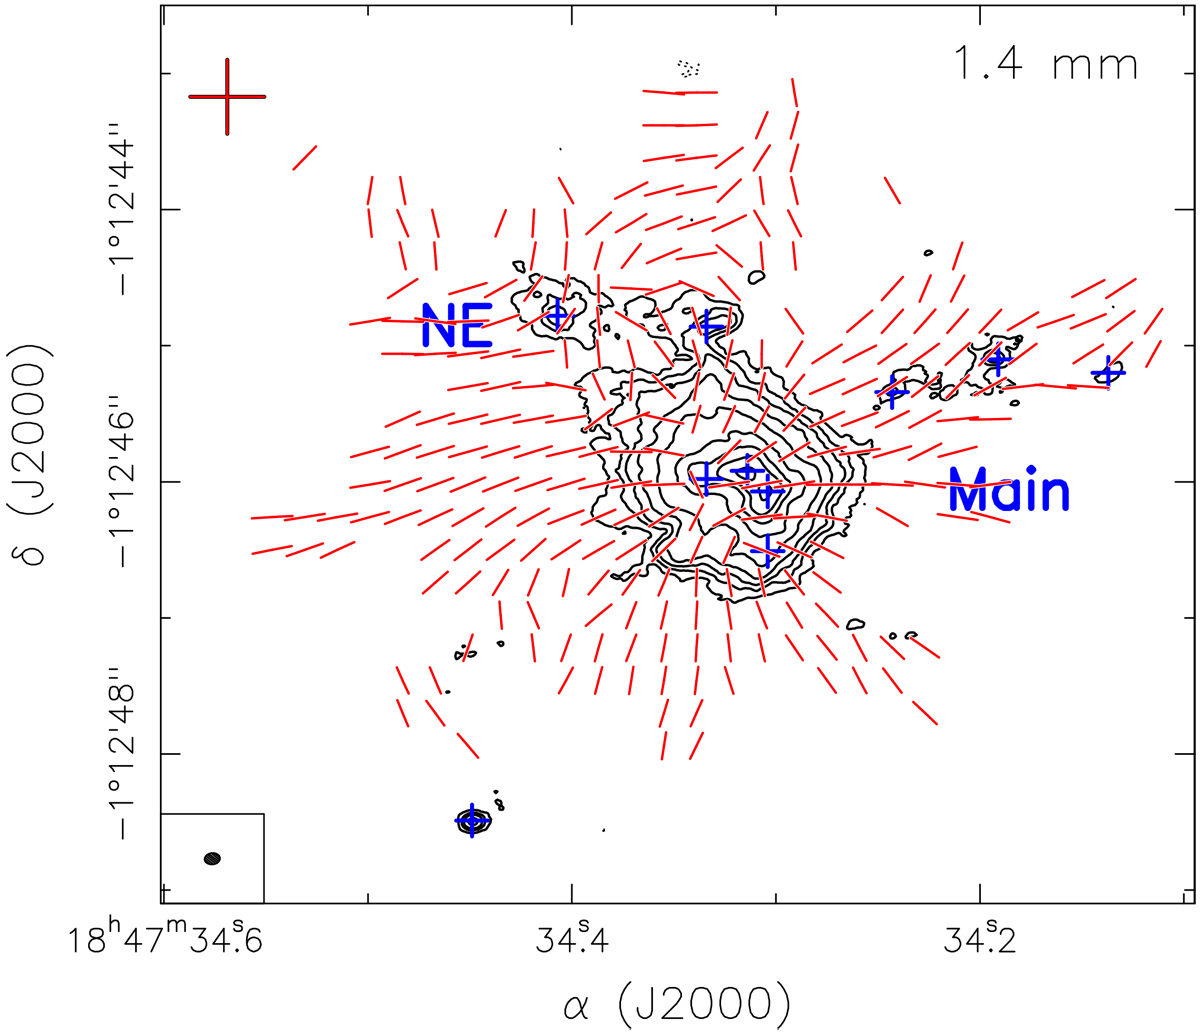
Magnetic field segments (red lines) toward the G31 HMC, obtained by rotating by 90° the polarization segments at 1.3 mm from Beltrán et al. (2019), overlapped on the ALMA 1.4 mm continuum emission map (contours). The segments are sampled every ten pixels. The contours are the same as in Fig. 6a. Negative contours are dotted black. The synthesized beam is shown in the lower left corner. The blue and red crosses indicate the position of the millimeter and/or centimeter sources in the region.
Current usage metrics show cumulative count of Article Views (full-text article views including HTML views, PDF and ePub downloads, according to the available data) and Abstracts Views on Vision4Press platform.
Data correspond to usage on the plateform after 2015. The current usage metrics is available 48-96 hours after online publication and is updated daily on week days.
Initial download of the metrics may take a while.