Fig. 7
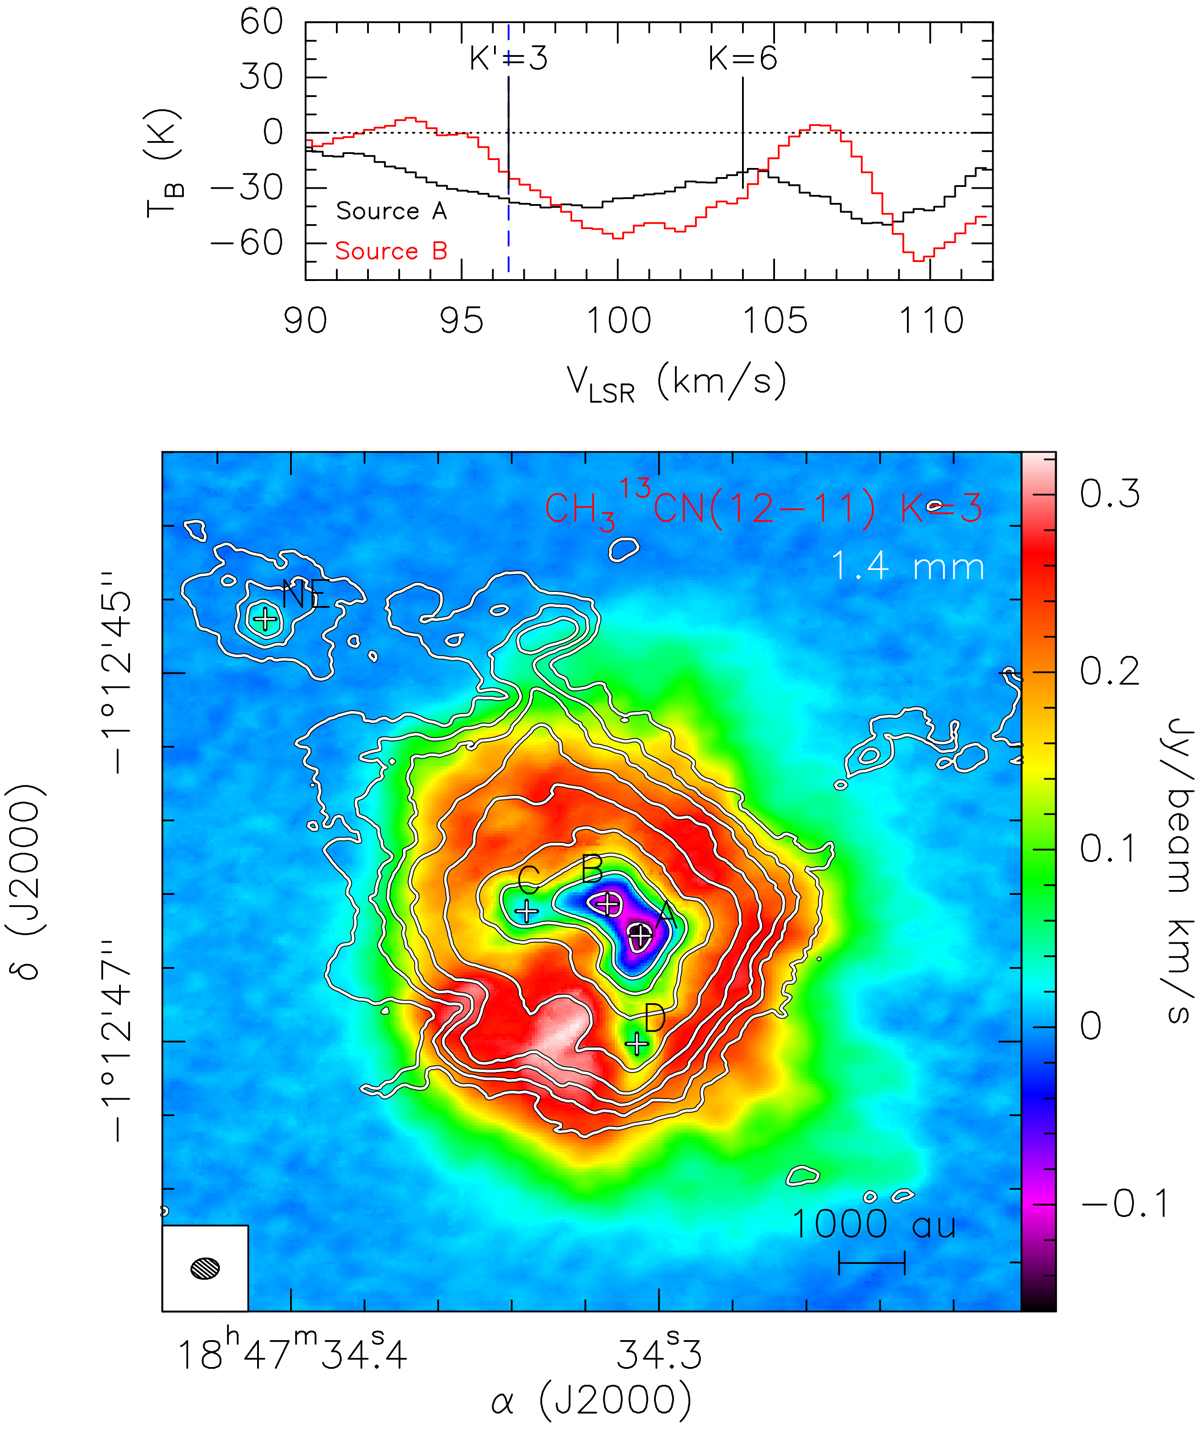
Bottom panel: overlay of the ALMA 1.4 mm continuum emission (white contours) on the integrated intensity (moment 0) map (colors) of CH![]() CN
K = 3 at an angular resolution of ~0.′′1. The contours are the same as in Fig. 1 (right panel). The synthesized beam isshown in the lower left corner. The white crosses indicate the positions of the
NE core and the four sources embedded in the Main core. Top panel: spectra of the CH
CN
K = 3 at an angular resolution of ~0.′′1. The contours are the same as in Fig. 1 (right panel). The synthesized beam isshown in the lower left corner. The white crosses indicate the positions of the
NE core and the four sources embedded in the Main core. Top panel: spectra of the CH![]() CN
K = 3 and CH3CNK = 6 transitions toward the 1.4 mm continuum emission peak of sources A (black) and B (red). The red-shifted absorption is clearly detected in both transitions. The vertical blue dashed line indicates the systemic LSR velocity of 96.5 km s.
CN
K = 3 and CH3CNK = 6 transitions toward the 1.4 mm continuum emission peak of sources A (black) and B (red). The red-shifted absorption is clearly detected in both transitions. The vertical blue dashed line indicates the systemic LSR velocity of 96.5 km s.
Current usage metrics show cumulative count of Article Views (full-text article views including HTML views, PDF and ePub downloads, according to the available data) and Abstracts Views on Vision4Press platform.
Data correspond to usage on the plateform after 2015. The current usage metrics is available 48-96 hours after online publication and is updated daily on week days.
Initial download of the metrics may take a while.