Fig. 6
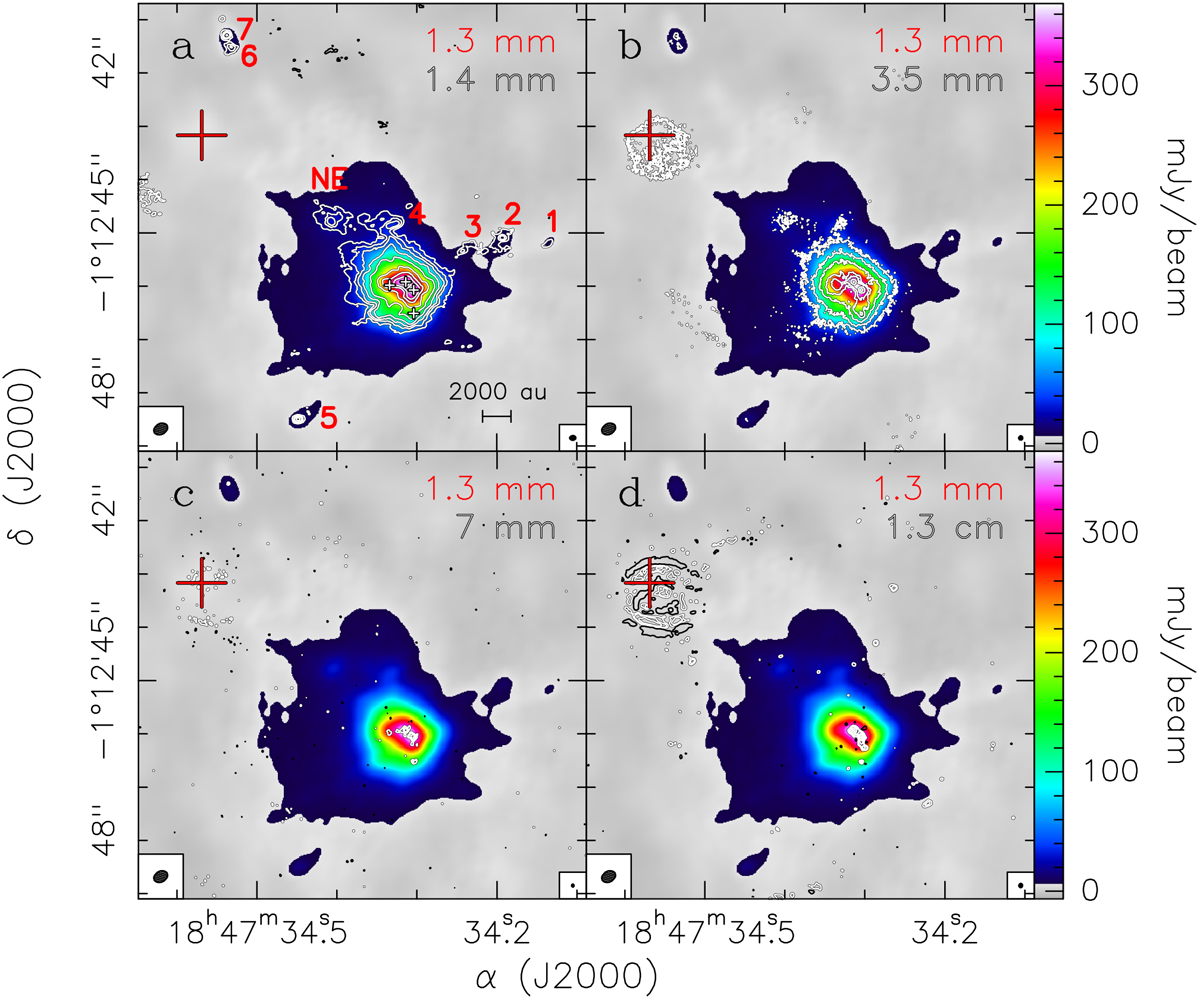
Overlay of the ALMA 1.4 mm (a) and 3.5 mm (b), and VLA 7 mm (c) and 1.3 cm (d) continuum emission (contours) on the ALMA 1.3 mm continuum emission of the G31 HMC observed by Beltrán et al. (2019). White contour levels are the same as in Figs. 1, 2, and 4. Black contours are −3 times 1σ. The 1.3 mm synthesized beam is shown in the lower left corner and that at the other wavelengths in the lower right corner of each panel. The red cross gives the position of the UC HII region imaged by Cesaroni et al. (1994), while the white crosses indicate the positions of the four sources embedded in the Main core. The labels of the other sources detected in the region are indicated in red (see Sect. 3.3) and their positions given in Table 5.
Current usage metrics show cumulative count of Article Views (full-text article views including HTML views, PDF and ePub downloads, according to the available data) and Abstracts Views on Vision4Press platform.
Data correspond to usage on the plateform after 2015. The current usage metrics is available 48-96 hours after online publication and is updated daily on week days.
Initial download of the metrics may take a while.