Fig. 1
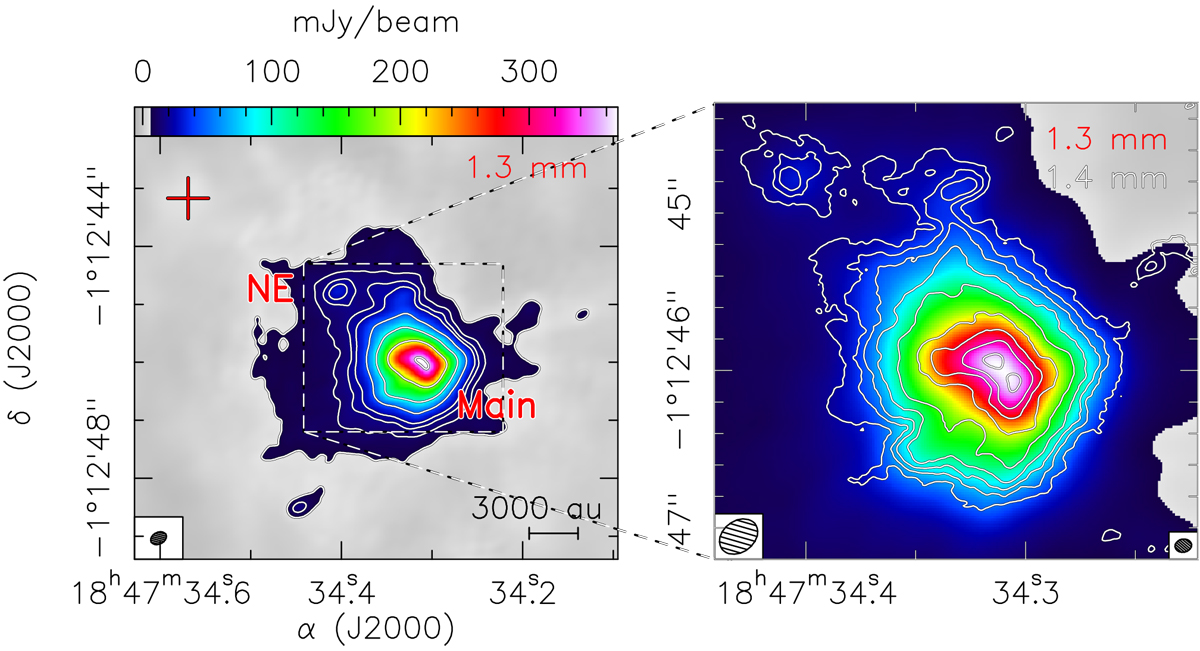
Left: ALMA map of the 1.3 mm continuum emission of the G31 HMC from Beltrán et al. (2019). The contours are − 5, 5, 10, 15, 20, 40, 80, 160, and 300 times 1σ, which is 1.2 mJy beam−1. The labels indicate the two cores, NE and Main, resolved by B18. The red cross indicates the position of the UC HII region imaged by Cesaroni et al. (1994). The synthesized beam of ~ 0.′′24 is shown in the lower left corner. Right: close-up of the central region around cores NE and Main that shows the ALMA 1.3 mm continuum emission image overlaid with the ALMA 1.4 mm continuum emission (white contours) observed with an angular resolution of ~ 0.′′1. White contours are 3, 6, 9, 15, 30, 60, 90, 120, and 165 times 1σ, which is 0.32 mJy beam−1. The ALMA 1.3 mm and 1.4 mm synthesized beam is shown in the lower left and right corner, respectively.
Current usage metrics show cumulative count of Article Views (full-text article views including HTML views, PDF and ePub downloads, according to the available data) and Abstracts Views on Vision4Press platform.
Data correspond to usage on the plateform after 2015. The current usage metrics is available 48-96 hours after online publication and is updated daily on week days.
Initial download of the metrics may take a while.