Fig. 9
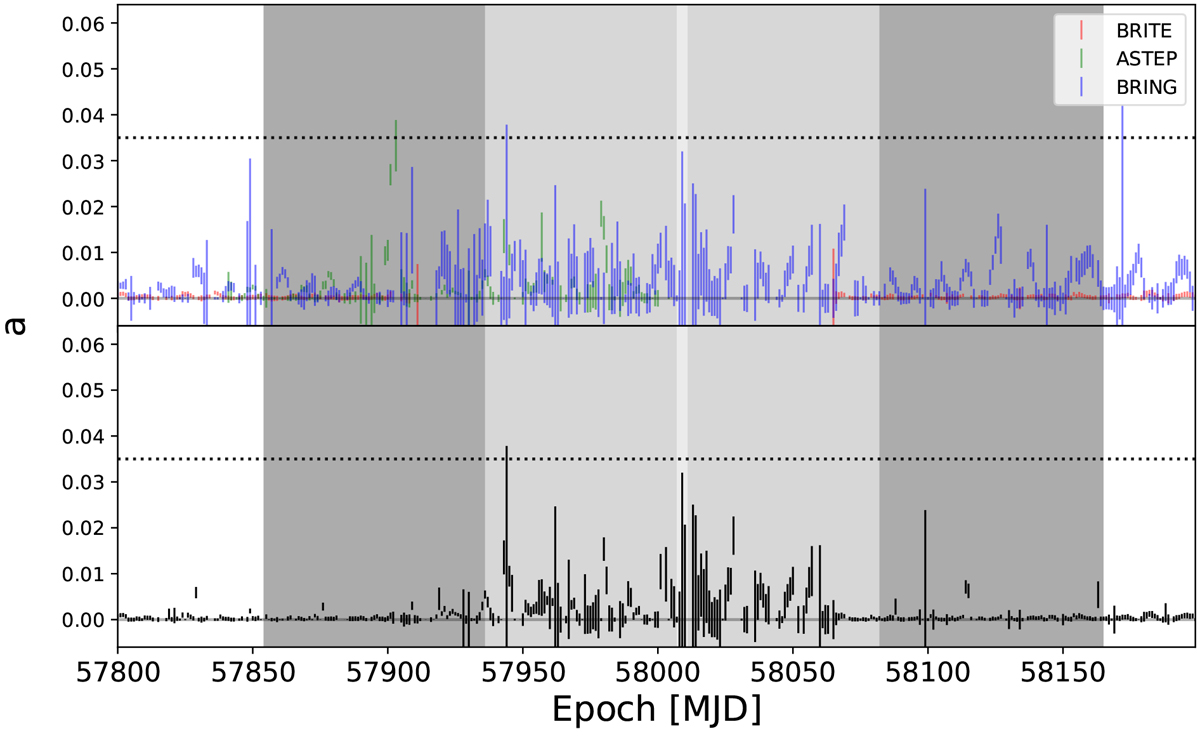
Result of fitting the 1981 model light curve (shown in Fig. 8) to the data from BRITE, ASTEP, and bRing. The upper panel shows the value of the fit amplitude a, and the dotted line shows the measured amplitude from the 1981 event. The error bars are one sigma limits determined from the lmfit algorithm. The lower panel shows the smallest value of a if there is more than one telescope with data. The dark grey and light grey panels indicate the 100% and 50% radii of the Hill sphere, respectively.
Current usage metrics show cumulative count of Article Views (full-text article views including HTML views, PDF and ePub downloads, according to the available data) and Abstracts Views on Vision4Press platform.
Data correspond to usage on the plateform after 2015. The current usage metrics is available 48-96 hours after online publication and is updated daily on week days.
Initial download of the metrics may take a while.