Free Access
Fig. 4
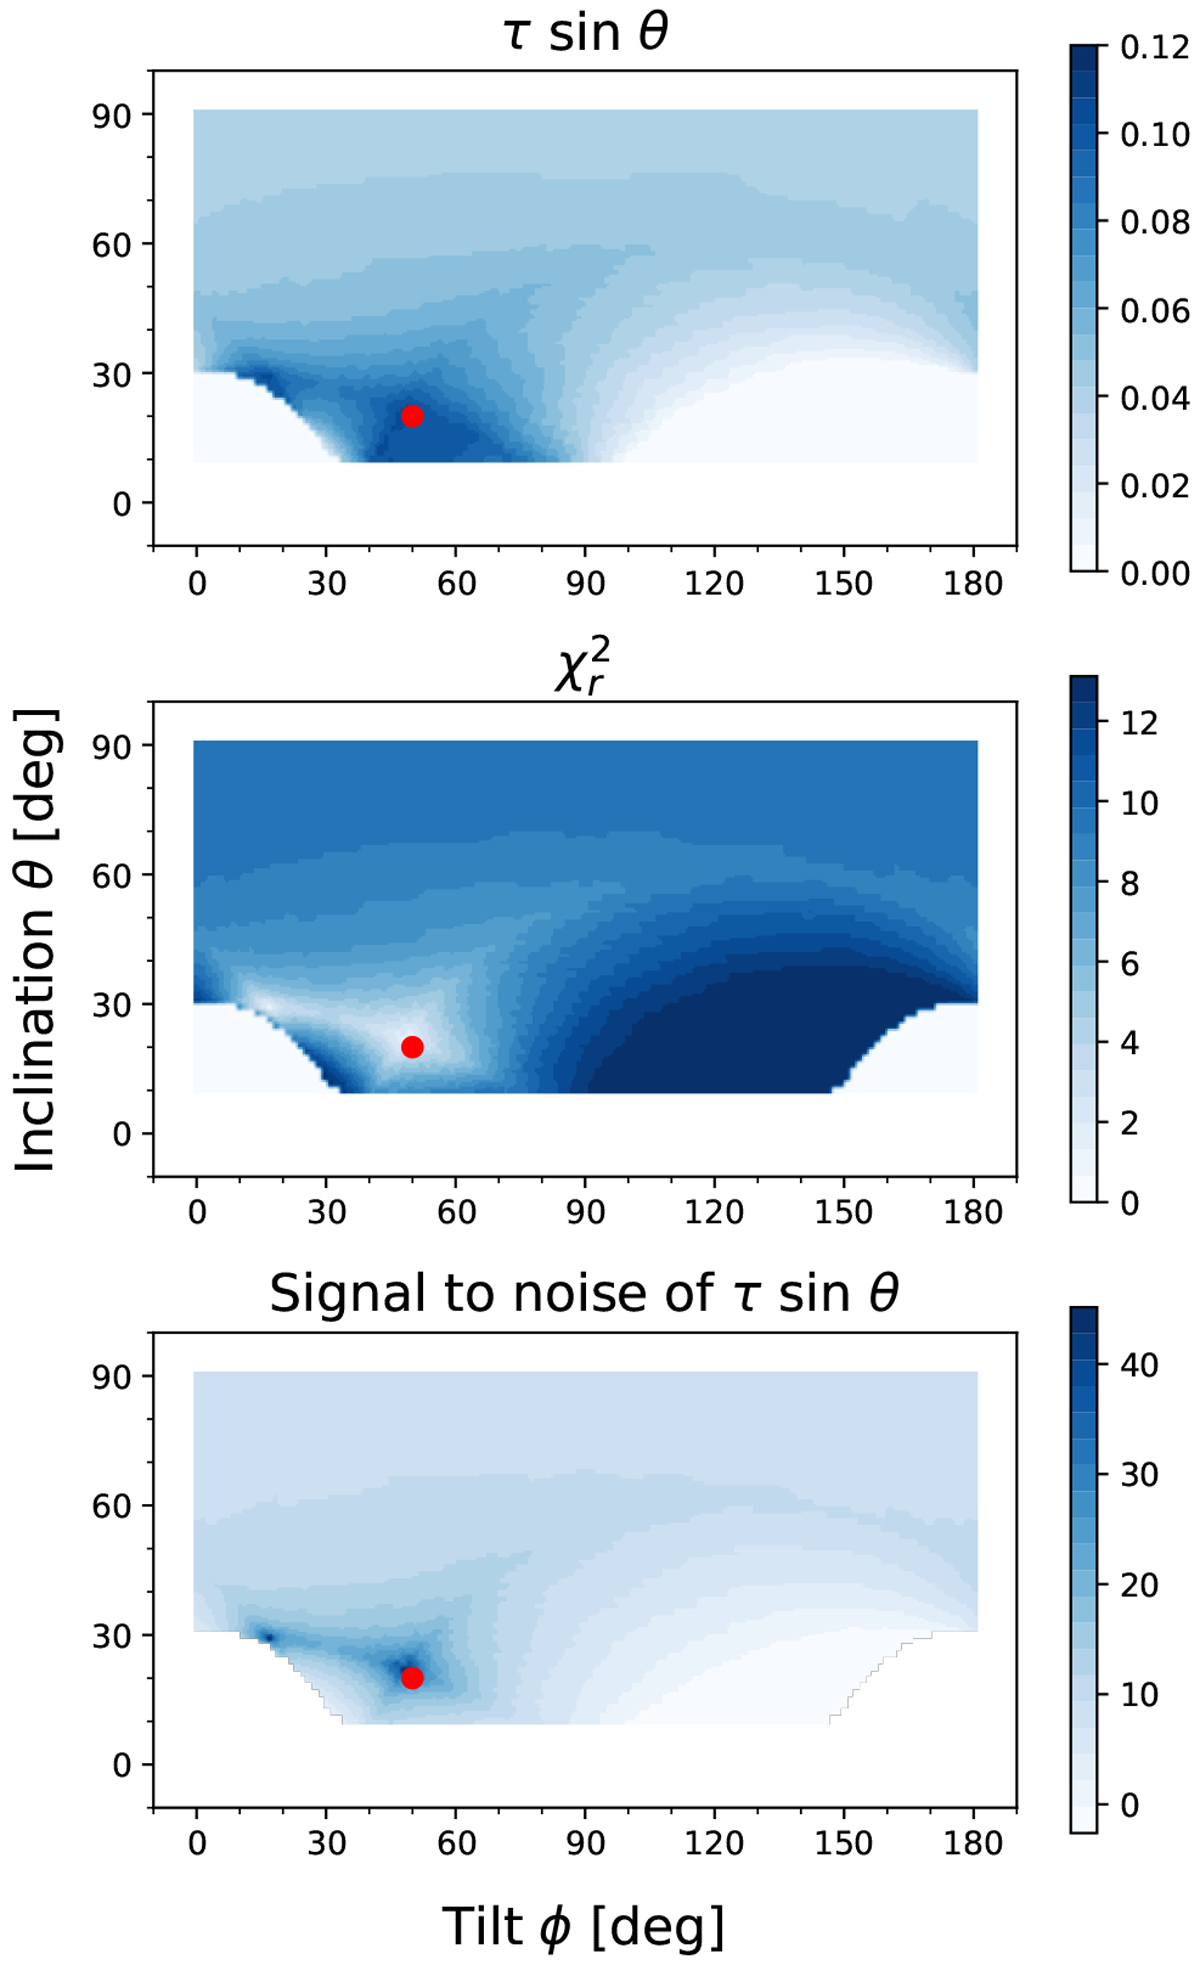
Fitting to a synthetic CPD dataset showing the estimated τ, the reduced chi squared, and the signal to noise of the measurement of τ. The red dot indicates the input inclination and tilt of the best fitting disk.
Current usage metrics show cumulative count of Article Views (full-text article views including HTML views, PDF and ePub downloads, according to the available data) and Abstracts Views on Vision4Press platform.
Data correspond to usage on the plateform after 2015. The current usage metrics is available 48-96 hours after online publication and is updated daily on week days.
Initial download of the metrics may take a while.