Fig. 3
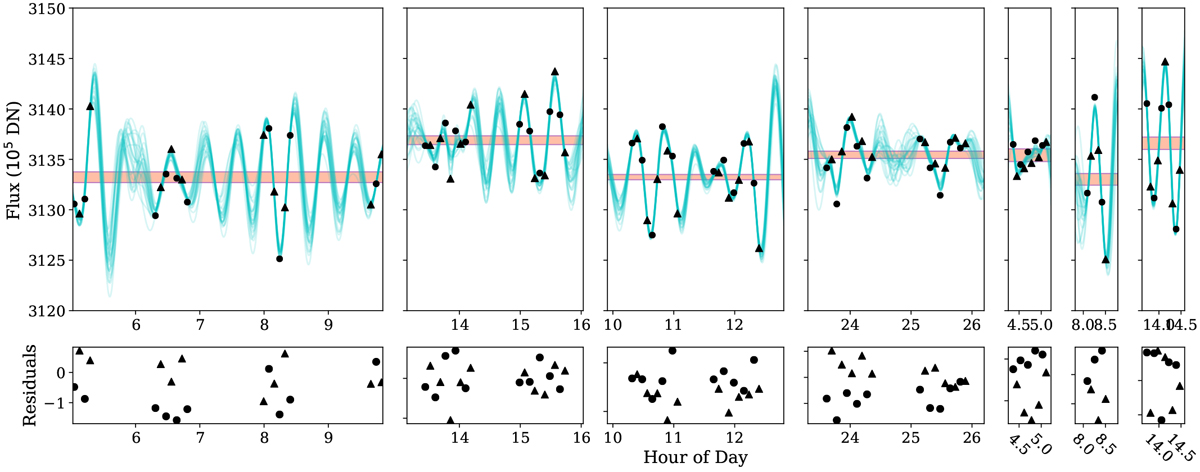
HST/WFC3/UVIS spatial scanning photometry obtained from all seven visits. The top panels show the data and model fits at each epoch. The forward scans are plotted as black circles. The reverse scans are plotted with black triangles and have been scaled to correct the offset between the two scan directions. The teal lines are Gaussian process models of the photometry using Gaussian process parameters drawn randomly from our Markov chain Monte Carlo analysis. The horizontal red line represents the 1σ statistical uncertainty on the flux level in each of the visits and does not include the uncertainty of the photometry between visits. The bottom row shows the average residuals to the fits.
Current usage metrics show cumulative count of Article Views (full-text article views including HTML views, PDF and ePub downloads, according to the available data) and Abstracts Views on Vision4Press platform.
Data correspond to usage on the plateform after 2015. The current usage metrics is available 48-96 hours after online publication and is updated daily on week days.
Initial download of the metrics may take a while.