Fig. 4.
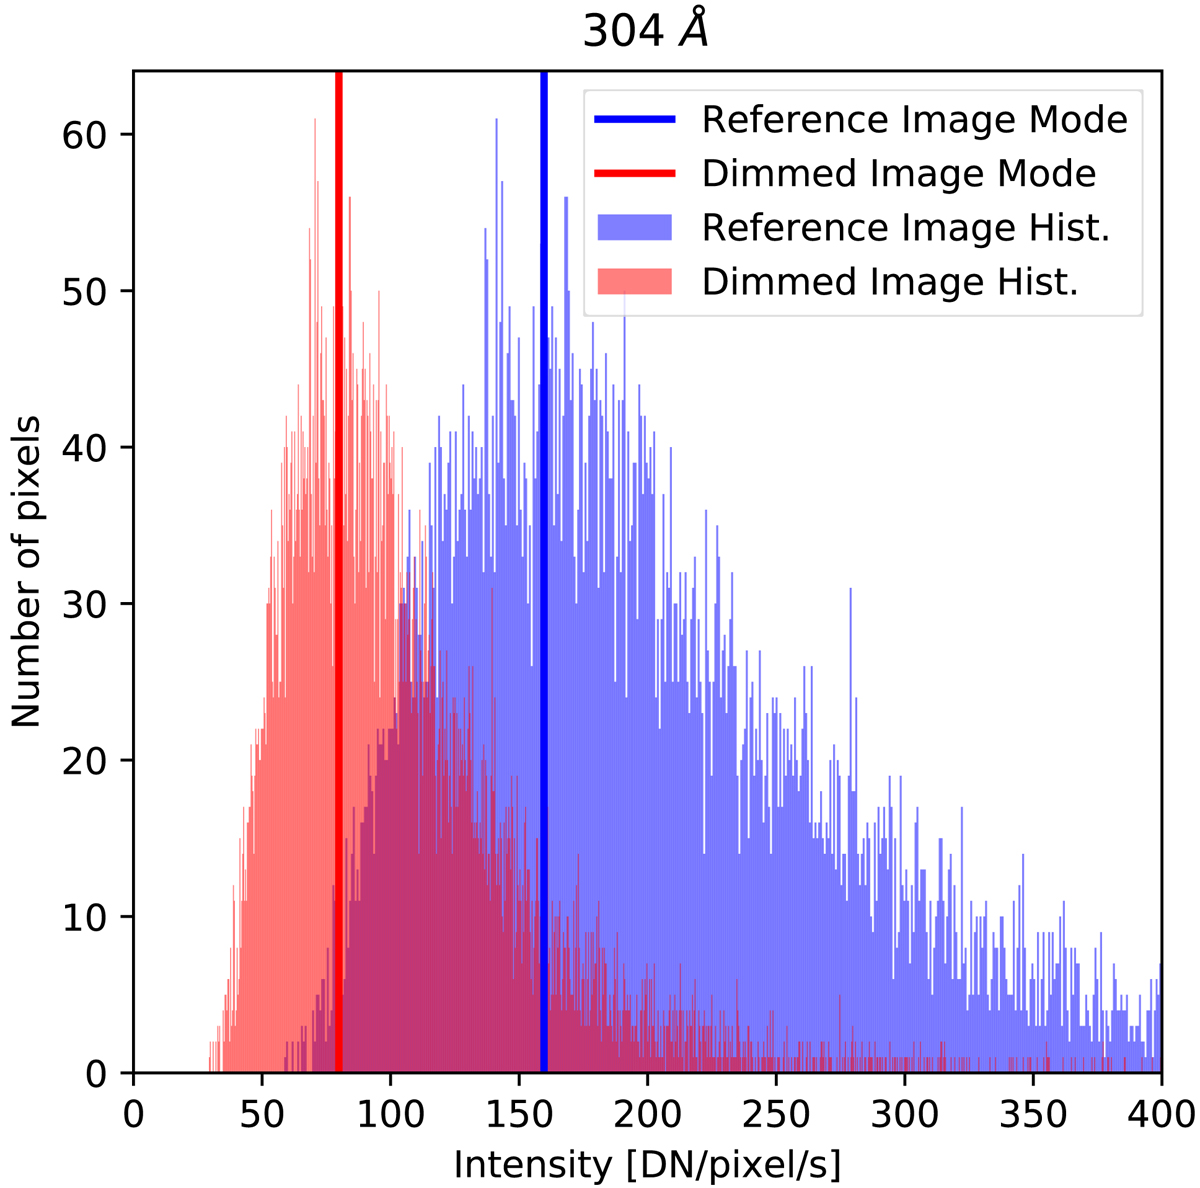
Histograms of the pixel values for the 304 Å channel. In blue we show the histogram for the refence image, and in red the histogram for the dimmed image. The y-axis is the number of pixels, and the x-axis is the pixel intensity [DN/px/s]. The modes are marked with blue and red lines for the reference and dimmed images, respectively.
Current usage metrics show cumulative count of Article Views (full-text article views including HTML views, PDF and ePub downloads, according to the available data) and Abstracts Views on Vision4Press platform.
Data correspond to usage on the plateform after 2015. The current usage metrics is available 48-96 hours after online publication and is updated daily on week days.
Initial download of the metrics may take a while.