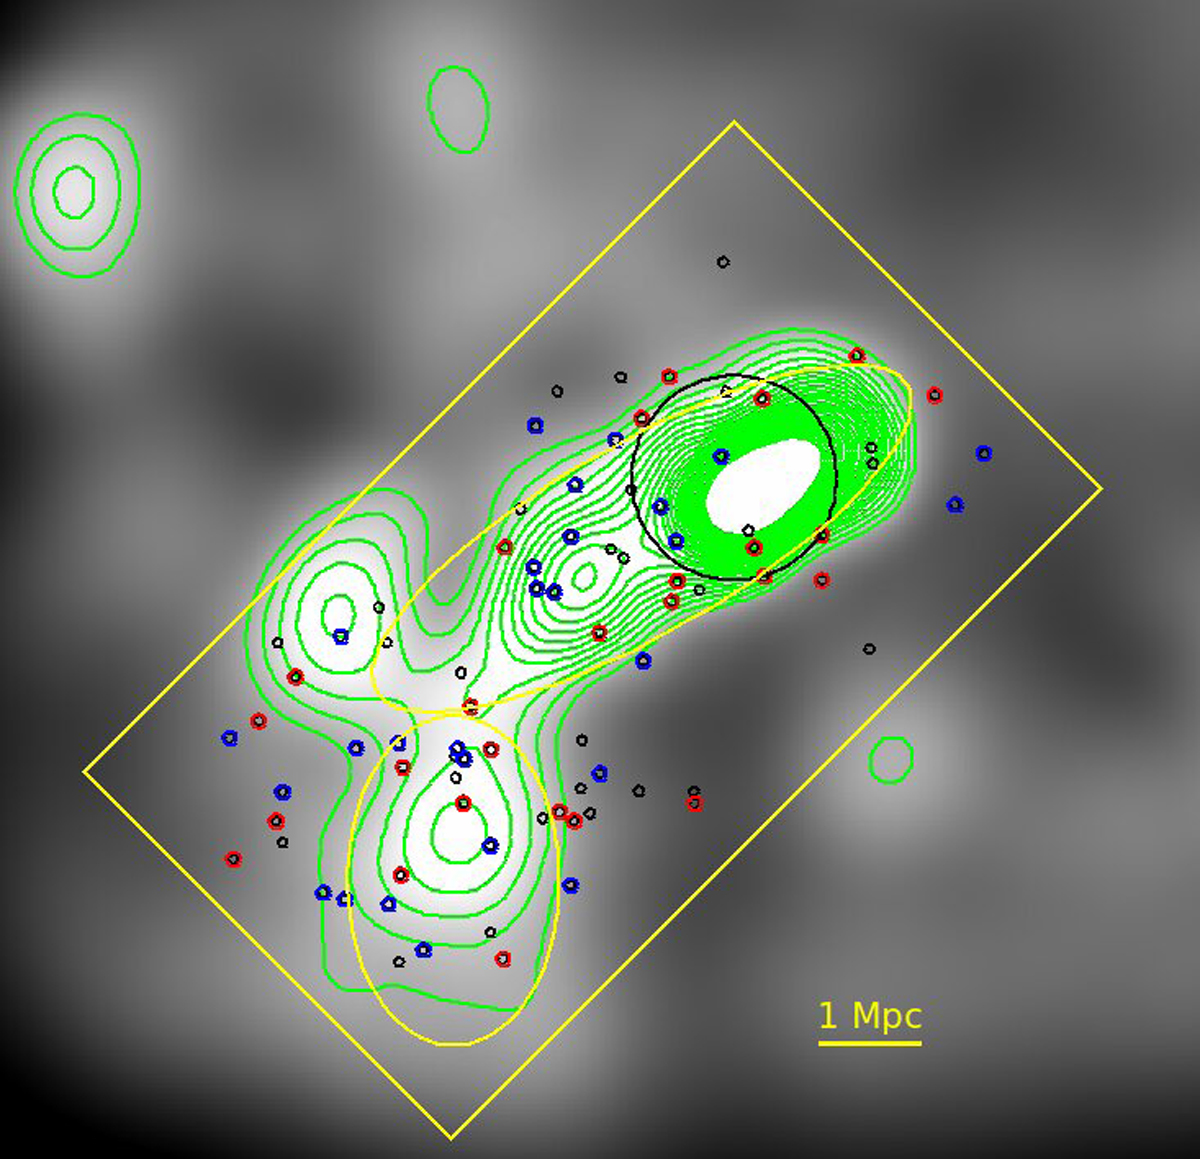
Fig. 3.

Density map of red sequence galaxies shown with grey shading and green isocontours, taken from Durret et al. (2016). The black circle is centred on the cluster centre, and has a 1 Mpc radius. The two yellow ellipses show the 3σ contours of the density distribution. The positions of the candidate jellyfish galaxies are indicated as follows: red circles indicate galaxies classified as jellyfish types 3, 4, and 5 according to the strictest classification; blue circles indicate additional galaxies classified as types 3, 4, and 5 according to the less strict classification; black circles indicate all candidate jellyfish galaxies from Table 2. The yellow rectangle shows the approximate HST coverage.
Current usage metrics show cumulative count of Article Views (full-text article views including HTML views, PDF and ePub downloads, according to the available data) and Abstracts Views on Vision4Press platform.
Data correspond to usage on the plateform after 2015. The current usage metrics is available 48-96 hours after online publication and is updated daily on week days.
Initial download of the metrics may take a while.


