Open Access
Fig. 2.
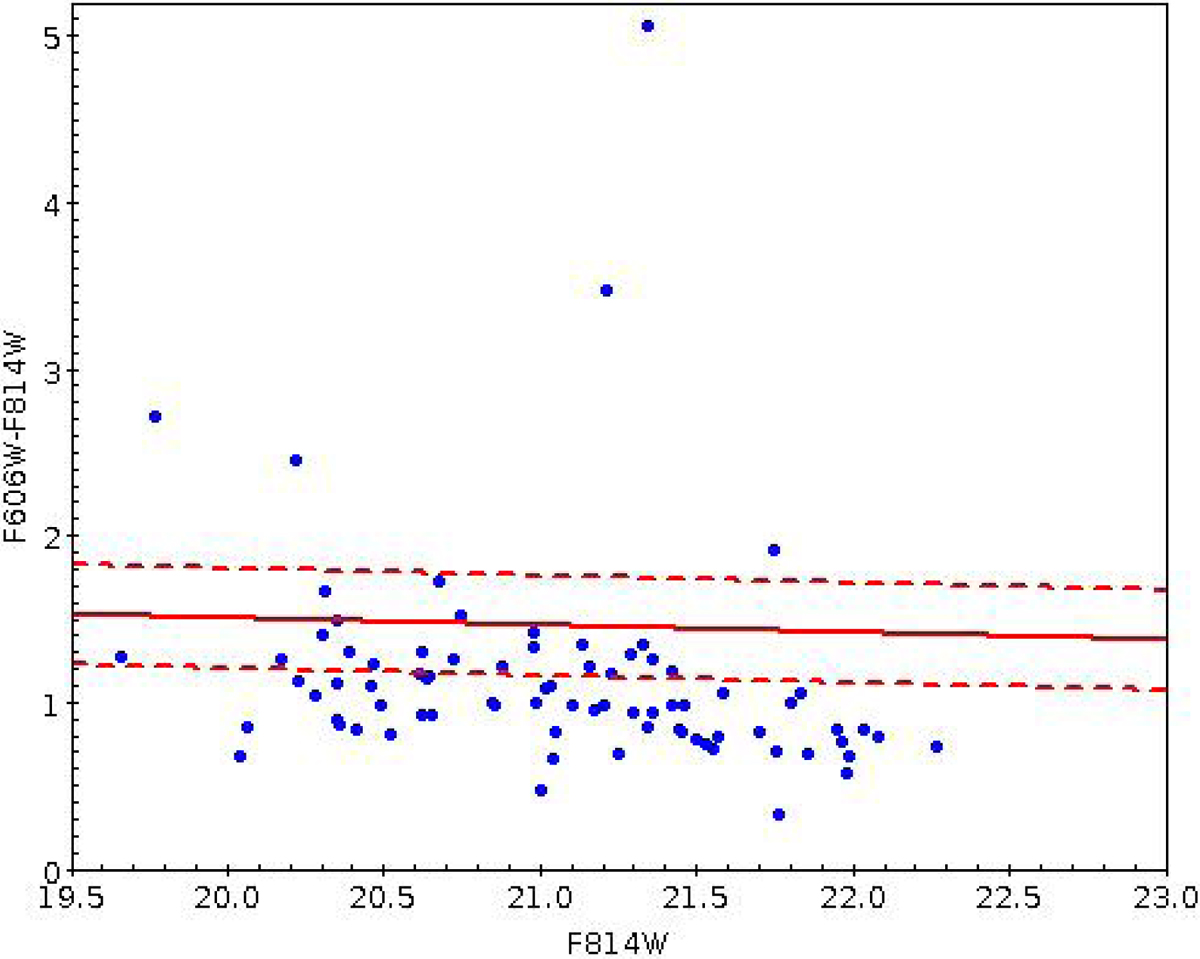
Colour-magnitude diagram for MACS0717. The blue points show the 81 candidate jellyfish galaxies belonging to the cluster. The solid red line shows the position of the red sequence and the dashed lines correspond to ±0.3 on either side of the red sequence.
Current usage metrics show cumulative count of Article Views (full-text article views including HTML views, PDF and ePub downloads, according to the available data) and Abstracts Views on Vision4Press platform.
Data correspond to usage on the plateform after 2015. The current usage metrics is available 48-96 hours after online publication and is updated daily on week days.
Initial download of the metrics may take a while.