Fig. 12.
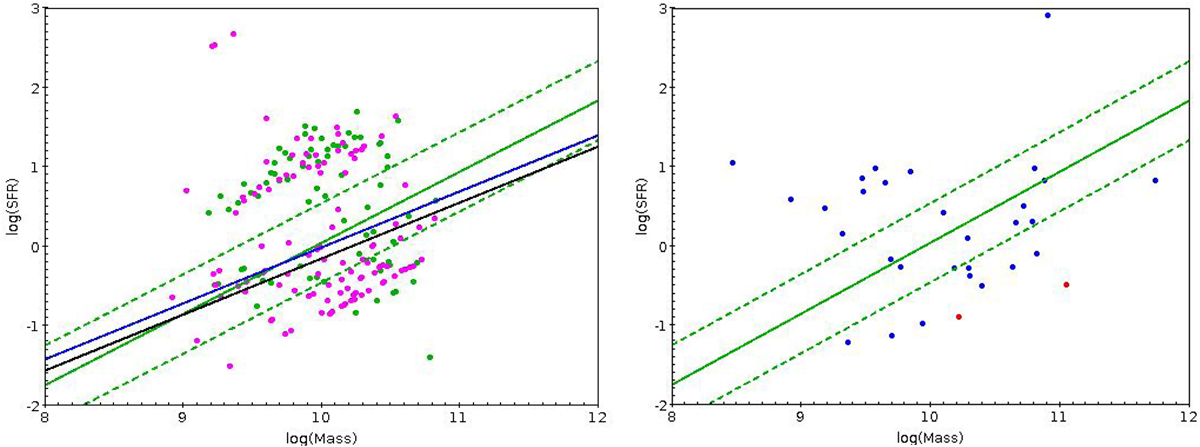
SFR as a function of stellar mass for the 79 jellyfish galaxy candidates in MACS0717 (left) and 31 galaxies of other clusters (right). On both figures, the three green lines indicate the relation found by Peng et al. (2010) and its approximate dispersion of ±0.5 (dashed lines). On the left figure, pink dots correspond to normal cluster galaxies with log(sSFR) ≥ −11 (see text). Blue and black lines show the relations found by Vulcani et al. (2018) for the disk SFR-mass relation for stripping and control sample galaxies respectively (see their Fig. 1). On the right panel, the two red points highlight the two galaxies with log(sSFR) < −11.
Current usage metrics show cumulative count of Article Views (full-text article views including HTML views, PDF and ePub downloads, according to the available data) and Abstracts Views on Vision4Press platform.
Data correspond to usage on the plateform after 2015. The current usage metrics is available 48-96 hours after online publication and is updated daily on week days.
Initial download of the metrics may take a while.