Fig. 7
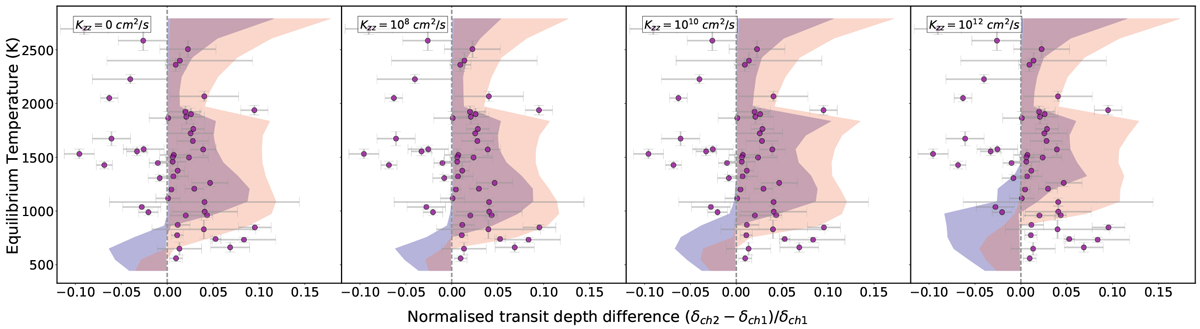
Normalized Spitzer transit depth difference as a function of the equilibrium temperature for the complete grids of transmission models created with our atmospheric model framework describedin Sects. 3.2.3 and 3.2.4. At each temperature, we show the models where the surface gravity is representative of our survey; i.e., at Teq > 1800 K we only plot g = 1500 and 5000 cm s−2. Panels from left to right show equilibrium chemistry (no vertical mixing), Kzz = 108, Kzz = 1010 and Kzz = 1012 cm2 s−1. The bluetranslucent shaded region shows the 1x solar composition and orange translucent shaded region shows the 30x solar composition (overlap in purple). Gray dashed line represents a gray opacity source showing no spectral features. Planets from our sample are overplotted in purple circles with their 1σ error bars.
Current usage metrics show cumulative count of Article Views (full-text article views including HTML views, PDF and ePub downloads, according to the available data) and Abstracts Views on Vision4Press platform.
Data correspond to usage on the plateform after 2015. The current usage metrics is available 48-96 hours after online publication and is updated daily on week days.
Initial download of the metrics may take a while.