Fig. 6
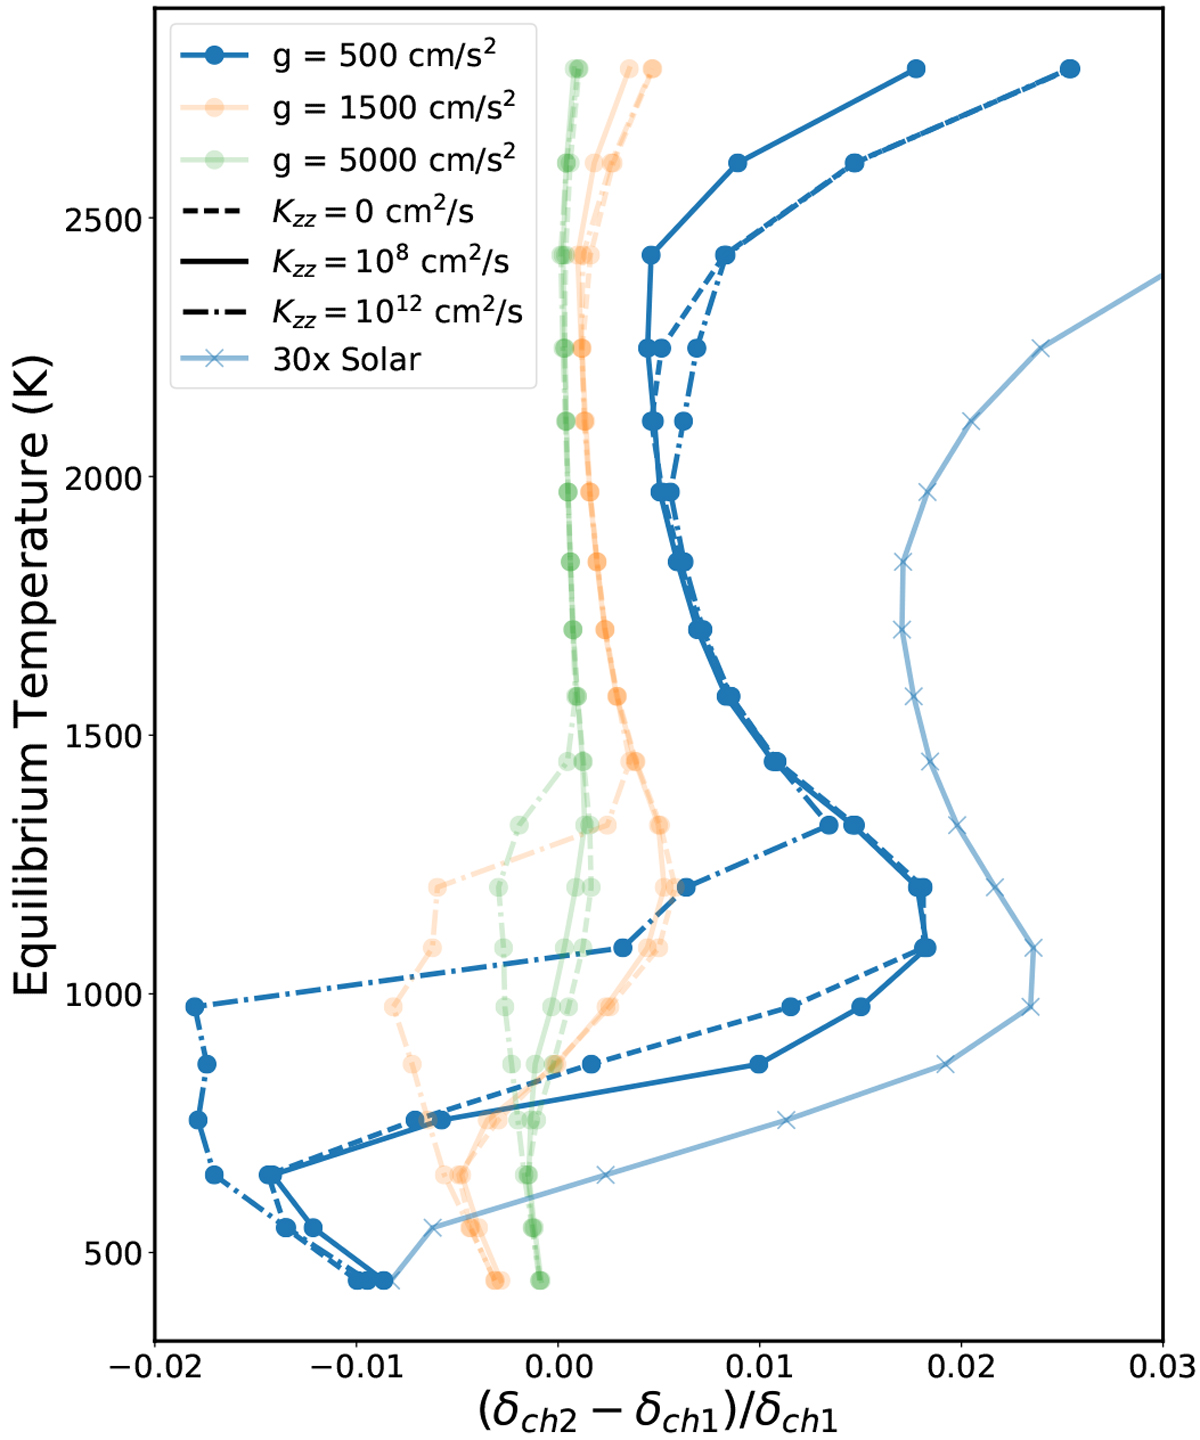
Normalized Spitzer transit depth difference as a function of the equilibrium temperature for a selection of the grid tracks created with our atmospheric model framework described in Sects. 3.2.3 and 3.2.4. We show a selection of grids with 1x solar composition and Rp = 2RJ. Different colors show different surface gravities: blue is g = 500 cm s−2, orange is g = 1500 cm s−2, and green is g = 5000 cm s−2. Different line styles show the effect of vertical mixing: solid line shows equilibrium chemistry, dashed is Kzz = 108 cm2 s−1, and dot-dashed is Kzz = 1012 cm2 s−1. The lighter blue line with ‘×’ markers shows a 30x solar track with Rp = 2RJ, g = 500 cm s−2, and Kzz = 0 cm2 s−1.
Current usage metrics show cumulative count of Article Views (full-text article views including HTML views, PDF and ePub downloads, according to the available data) and Abstracts Views on Vision4Press platform.
Data correspond to usage on the plateform after 2015. The current usage metrics is available 48-96 hours after online publication and is updated daily on week days.
Initial download of the metrics may take a while.