Fig. 5
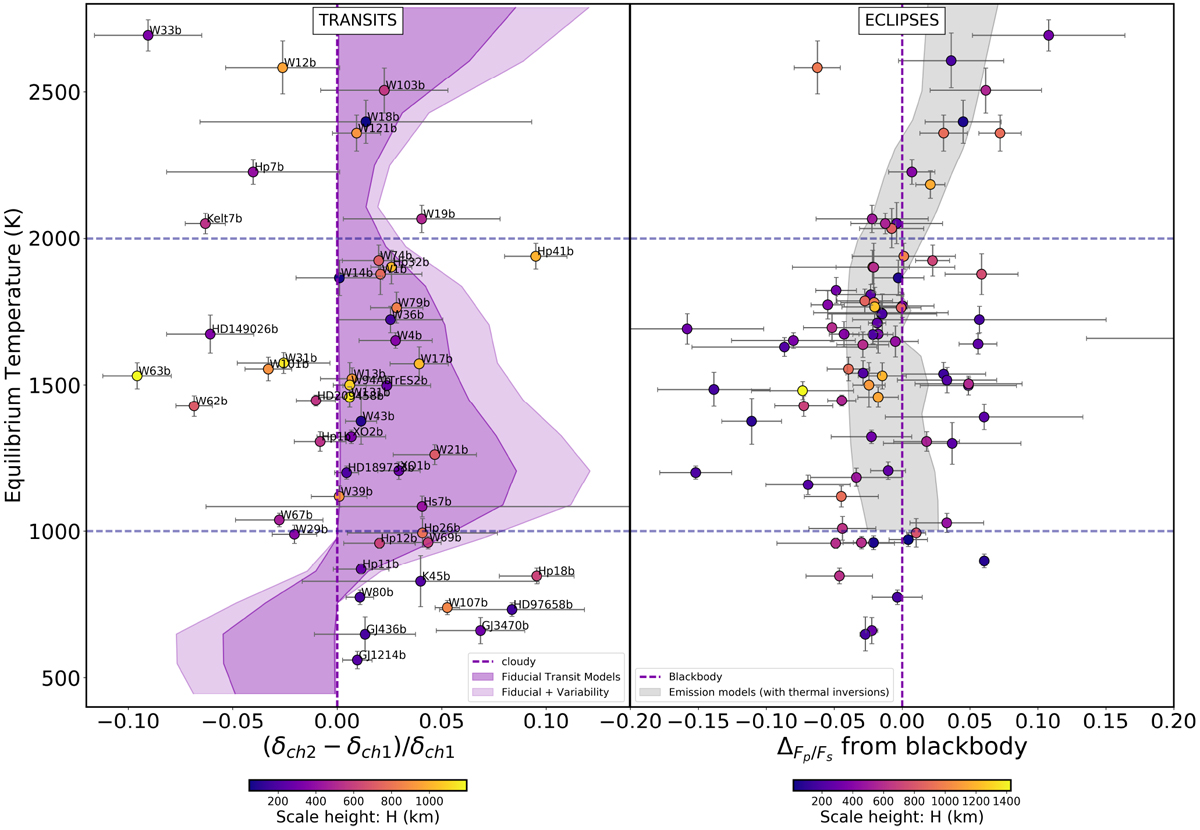
Left panel: difference in transit depths between 4.5 and 3.6 μm normalized to the transit depth at 3.6 μm plotted against equilibrium temperature. The 1σuncertainties are shown in gray, and the color bar depicts the scale height in km. The shaded area on the left panel shows our grid of solar composition cloud-free equilibrium chemistry models; the extended lighter region is corrected for stellar variability. The dashed purple vertical line at zero is where planets with low-pressure gray clouds would lie. Right panel: deviation from the black body in emission against the equilibrium temperature, presented in Baxter et al. (2020). The color scale shows the scale height in km and the shaded region shows the grid of models containing temperature inversions.
Current usage metrics show cumulative count of Article Views (full-text article views including HTML views, PDF and ePub downloads, according to the available data) and Abstracts Views on Vision4Press platform.
Data correspond to usage on the plateform after 2015. The current usage metrics is available 48-96 hours after online publication and is updated daily on week days.
Initial download of the metrics may take a while.