Fig. 3
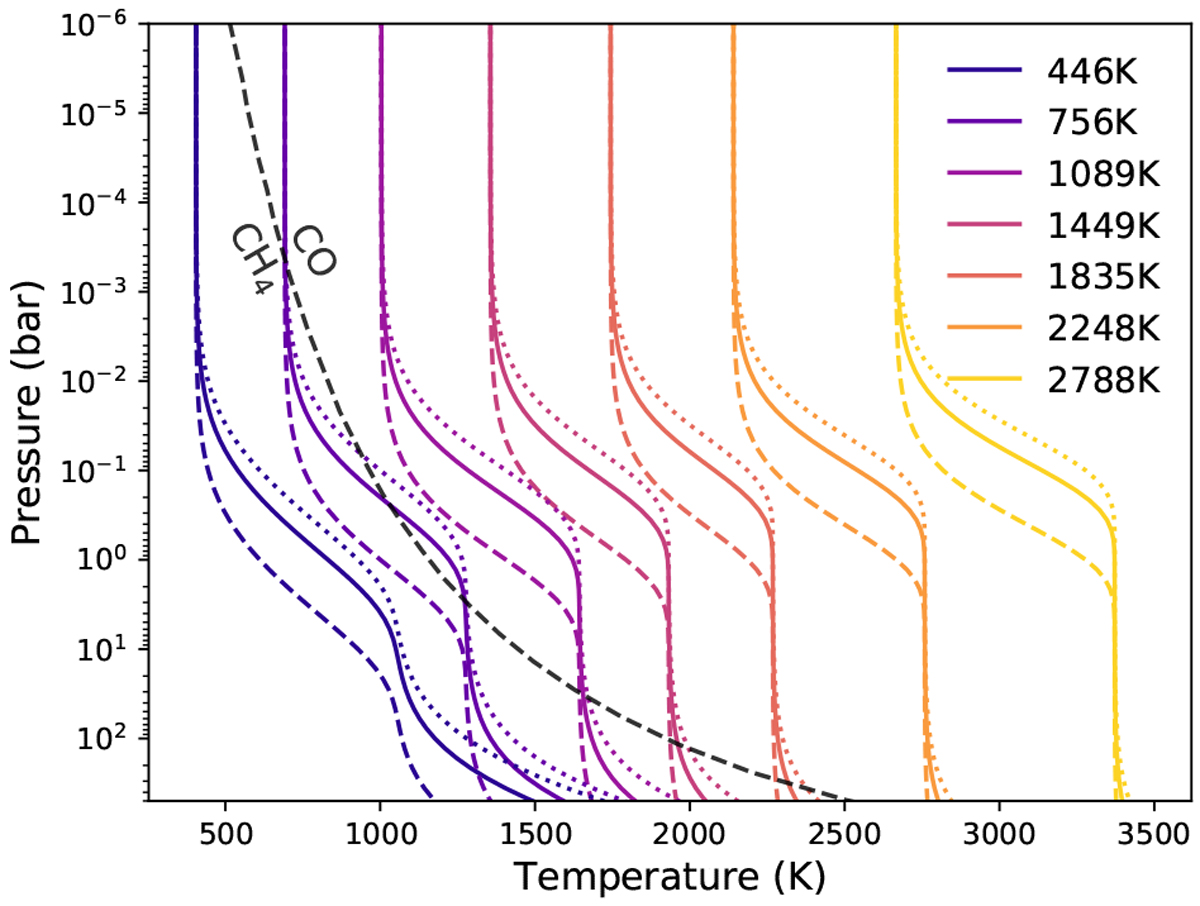
Analytical TP profiles for a grid of models spanning equilibrium temperatures ~400–2800 K, showing every ~400 K. For each temperature, we show three profiles where the surface gravity is varied: dotted, solid, and dashed lines represent 500, 1000, and 5000 cm s−2 respectively. Grey dashedline represents the gas transition between CH4- and CO-dominated atmospheres when chemical equilibrium is assumed.
Current usage metrics show cumulative count of Article Views (full-text article views including HTML views, PDF and ePub downloads, according to the available data) and Abstracts Views on Vision4Press platform.
Data correspond to usage on the plateform after 2015. The current usage metrics is available 48-96 hours after online publication and is updated daily on week days.
Initial download of the metrics may take a while.