Free Access
Fig. C.1
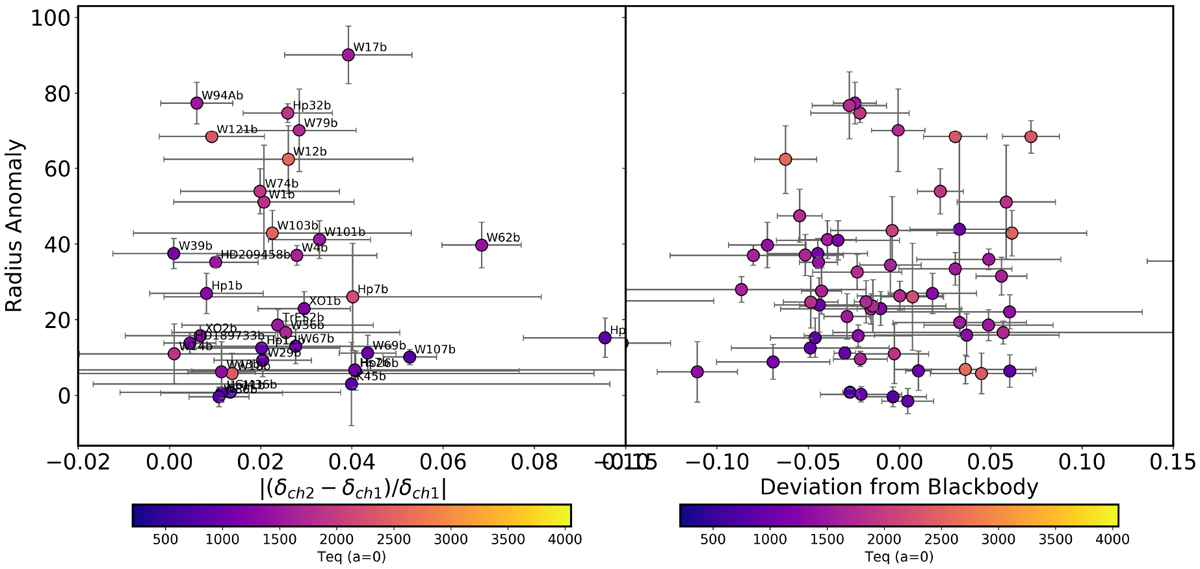
Radius anomaly (calculated using models from Thorngren et al. (2016) and Thorngren & Fortney (2018) against the absolute value of the normalized difference in transit depths for the available planets. The color scale is the equilibrium temperatureof the planet.
Current usage metrics show cumulative count of Article Views (full-text article views including HTML views, PDF and ePub downloads, according to the available data) and Abstracts Views on Vision4Press platform.
Data correspond to usage on the plateform after 2015. The current usage metrics is available 48-96 hours after online publication and is updated daily on week days.
Initial download of the metrics may take a while.