Fig. B.1
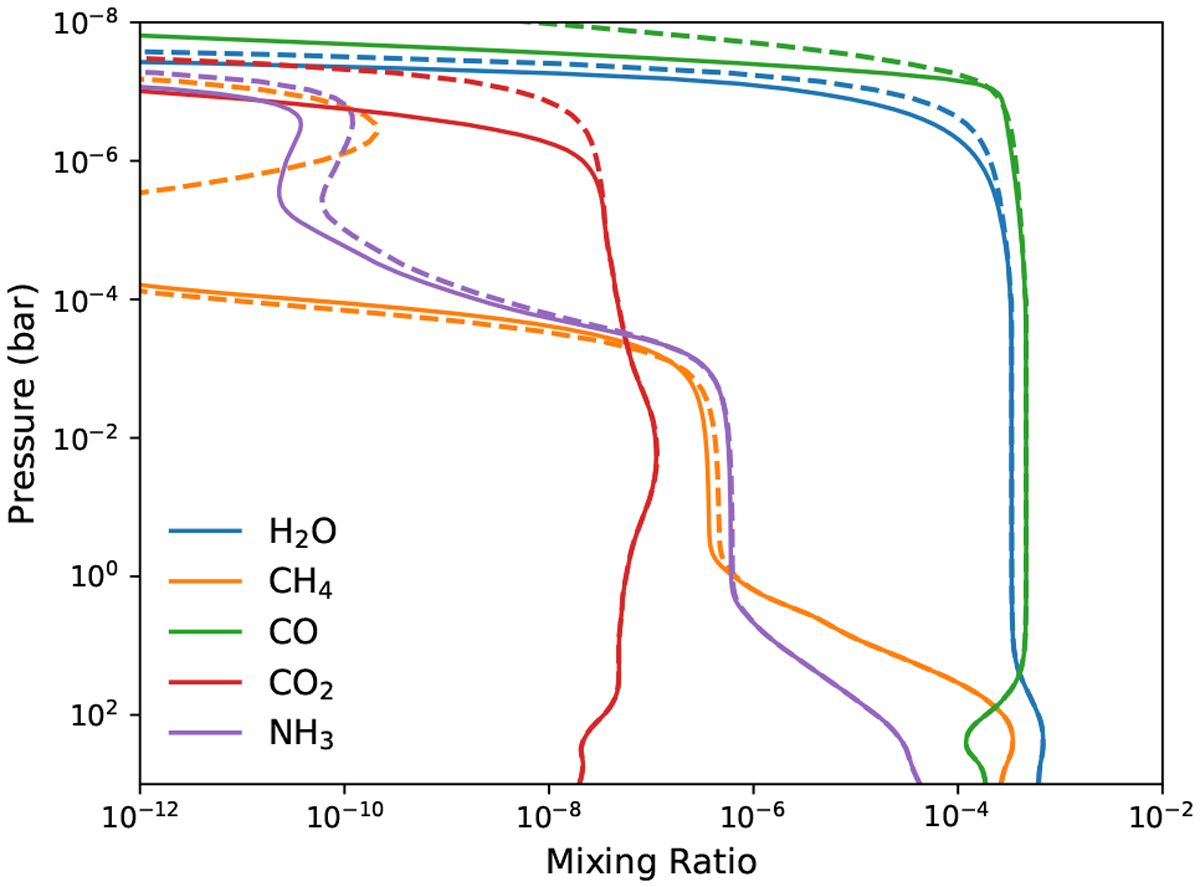
Abundance mixing ratios at different pressures for the main species in the Spitzer bandpasses in HD 209458 b. The solid line shows the results from our VULCAN calculation and the dashed line the results from Moses et al. (2011). The temperatureand eddy-diffusion structure are taken the same as the dayside-average P-T profile in Moses et al. (2011). The solar flux is also used as an analog for HD 290458 at a distance of 0.04747 AU.
Current usage metrics show cumulative count of Article Views (full-text article views including HTML views, PDF and ePub downloads, according to the available data) and Abstracts Views on Vision4Press platform.
Data correspond to usage on the plateform after 2015. The current usage metrics is available 48-96 hours after online publication and is updated daily on week days.
Initial download of the metrics may take a while.