Free Access
Fig. A.2
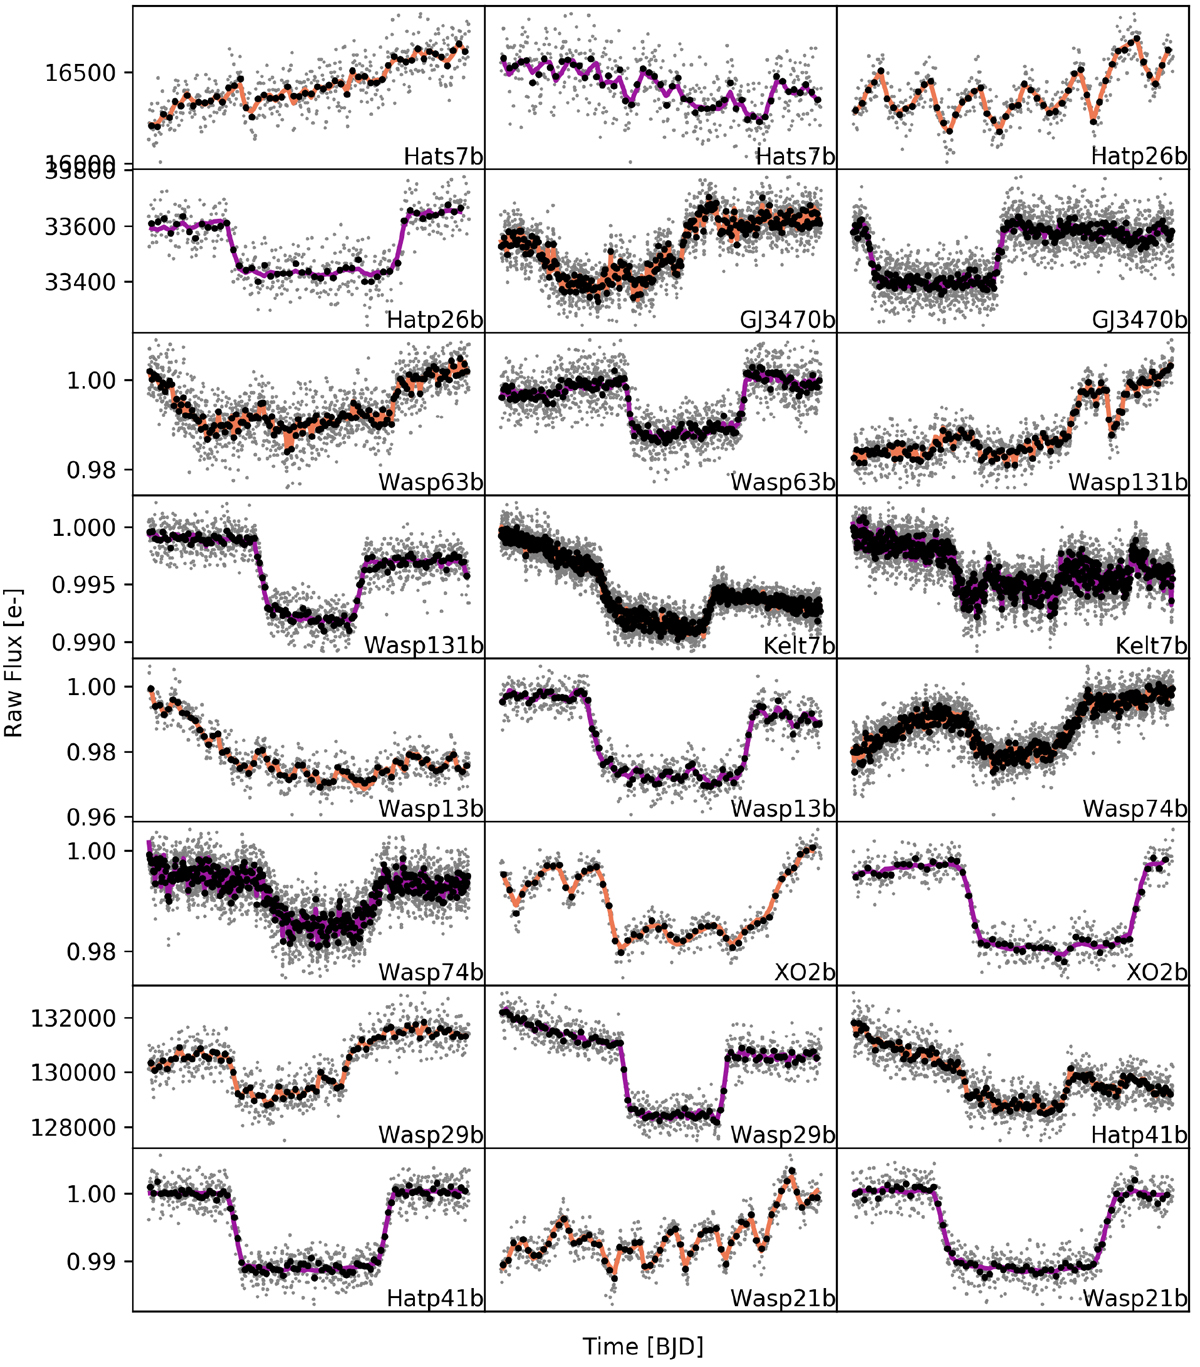
Raw light curves for each planet. Flux binned in 5 min is shown in black and 30 s is shown in gray. Colored lines indicate the best-fit instrumental and transit model from our MCMC analysis.
Current usage metrics show cumulative count of Article Views (full-text article views including HTML views, PDF and ePub downloads, according to the available data) and Abstracts Views on Vision4Press platform.
Data correspond to usage on the plateform after 2015. The current usage metrics is available 48-96 hours after online publication and is updated daily on week days.
Initial download of the metrics may take a while.