Fig. A.1
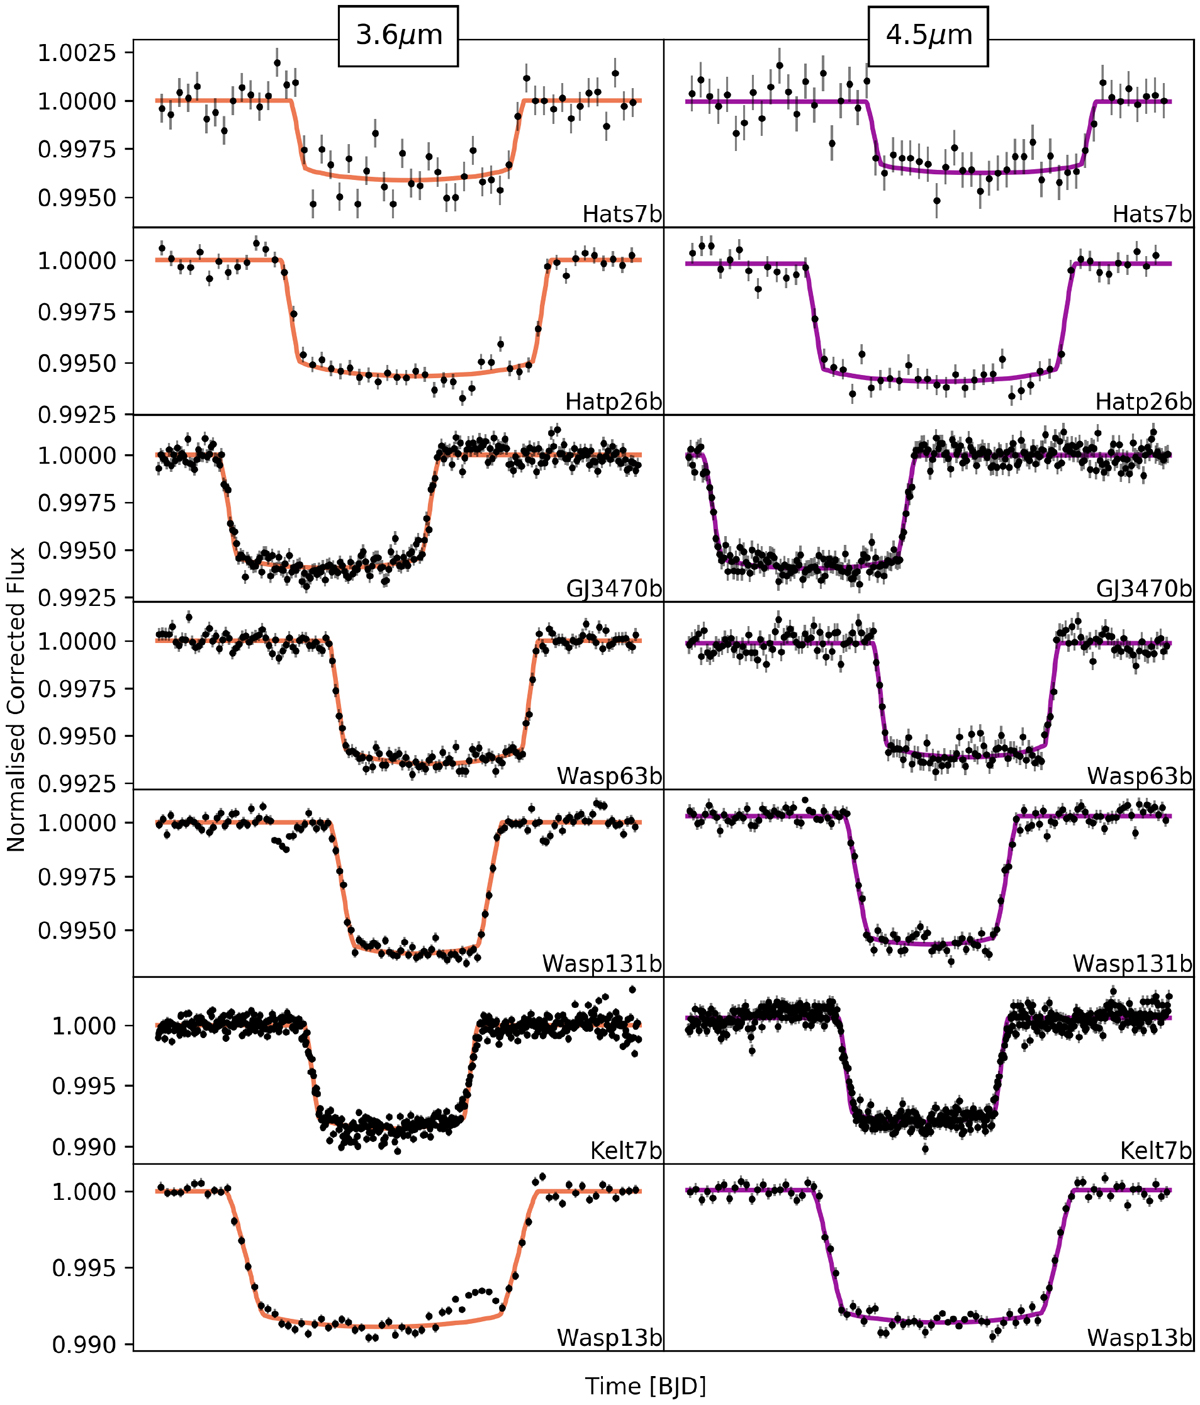
Normalized and systematic-error-corrected transit light curves for each planet at 3.6 (left column, orange) and 4.5 μm (right column, purple). 1 σerror bars are those originally calculated from scaled photon noise. The data and the error bars are binned in five-minute intervals for display purposes. Continuous curves show the best-fit transit models in each band-pass for comparison. Kepler-45b displays the result of four phase folded light curves in each channel.
Current usage metrics show cumulative count of Article Views (full-text article views including HTML views, PDF and ePub downloads, according to the available data) and Abstracts Views on Vision4Press platform.
Data correspond to usage on the plateform after 2015. The current usage metrics is available 48-96 hours after online publication and is updated daily on week days.
Initial download of the metrics may take a while.