Fig. 7
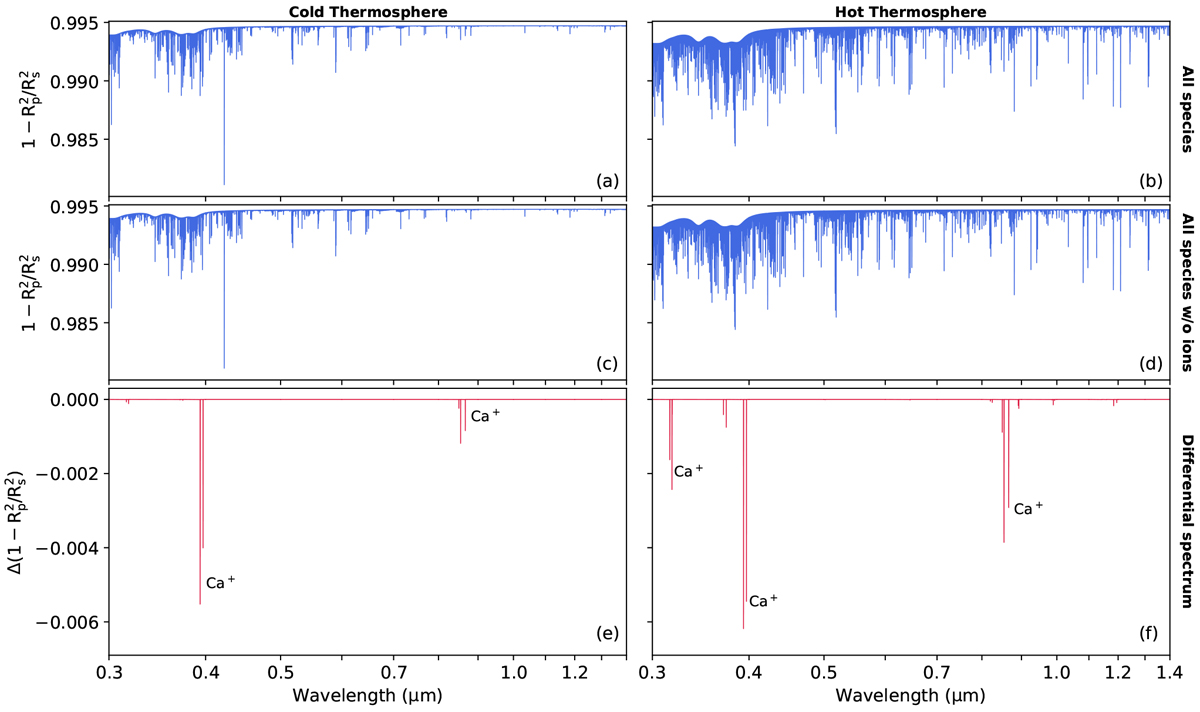
(a) Synthetic high-resolution spectrum of HAT-P-7b over a wide wavelength range, assuming a cold thermosphere scenario with 5000 K. (c) Similar to (a) except ion are excluded. (e) The difference between (a) and (c) that shows the significance of ion signatures. (b), (d), and (f) are similar to (a), (c), and (e) but assuming a hot thermosphere with 10 000 K. The pronounced ions are marked in the differential spectrum panels, (e) and (f).
Current usage metrics show cumulative count of Article Views (full-text article views including HTML views, PDF and ePub downloads, according to the available data) and Abstracts Views on Vision4Press platform.
Data correspond to usage on the plateform after 2015. The current usage metrics is available 48-96 hours after online publication and is updated daily on week days.
Initial download of the metrics may take a while.