Fig. 4
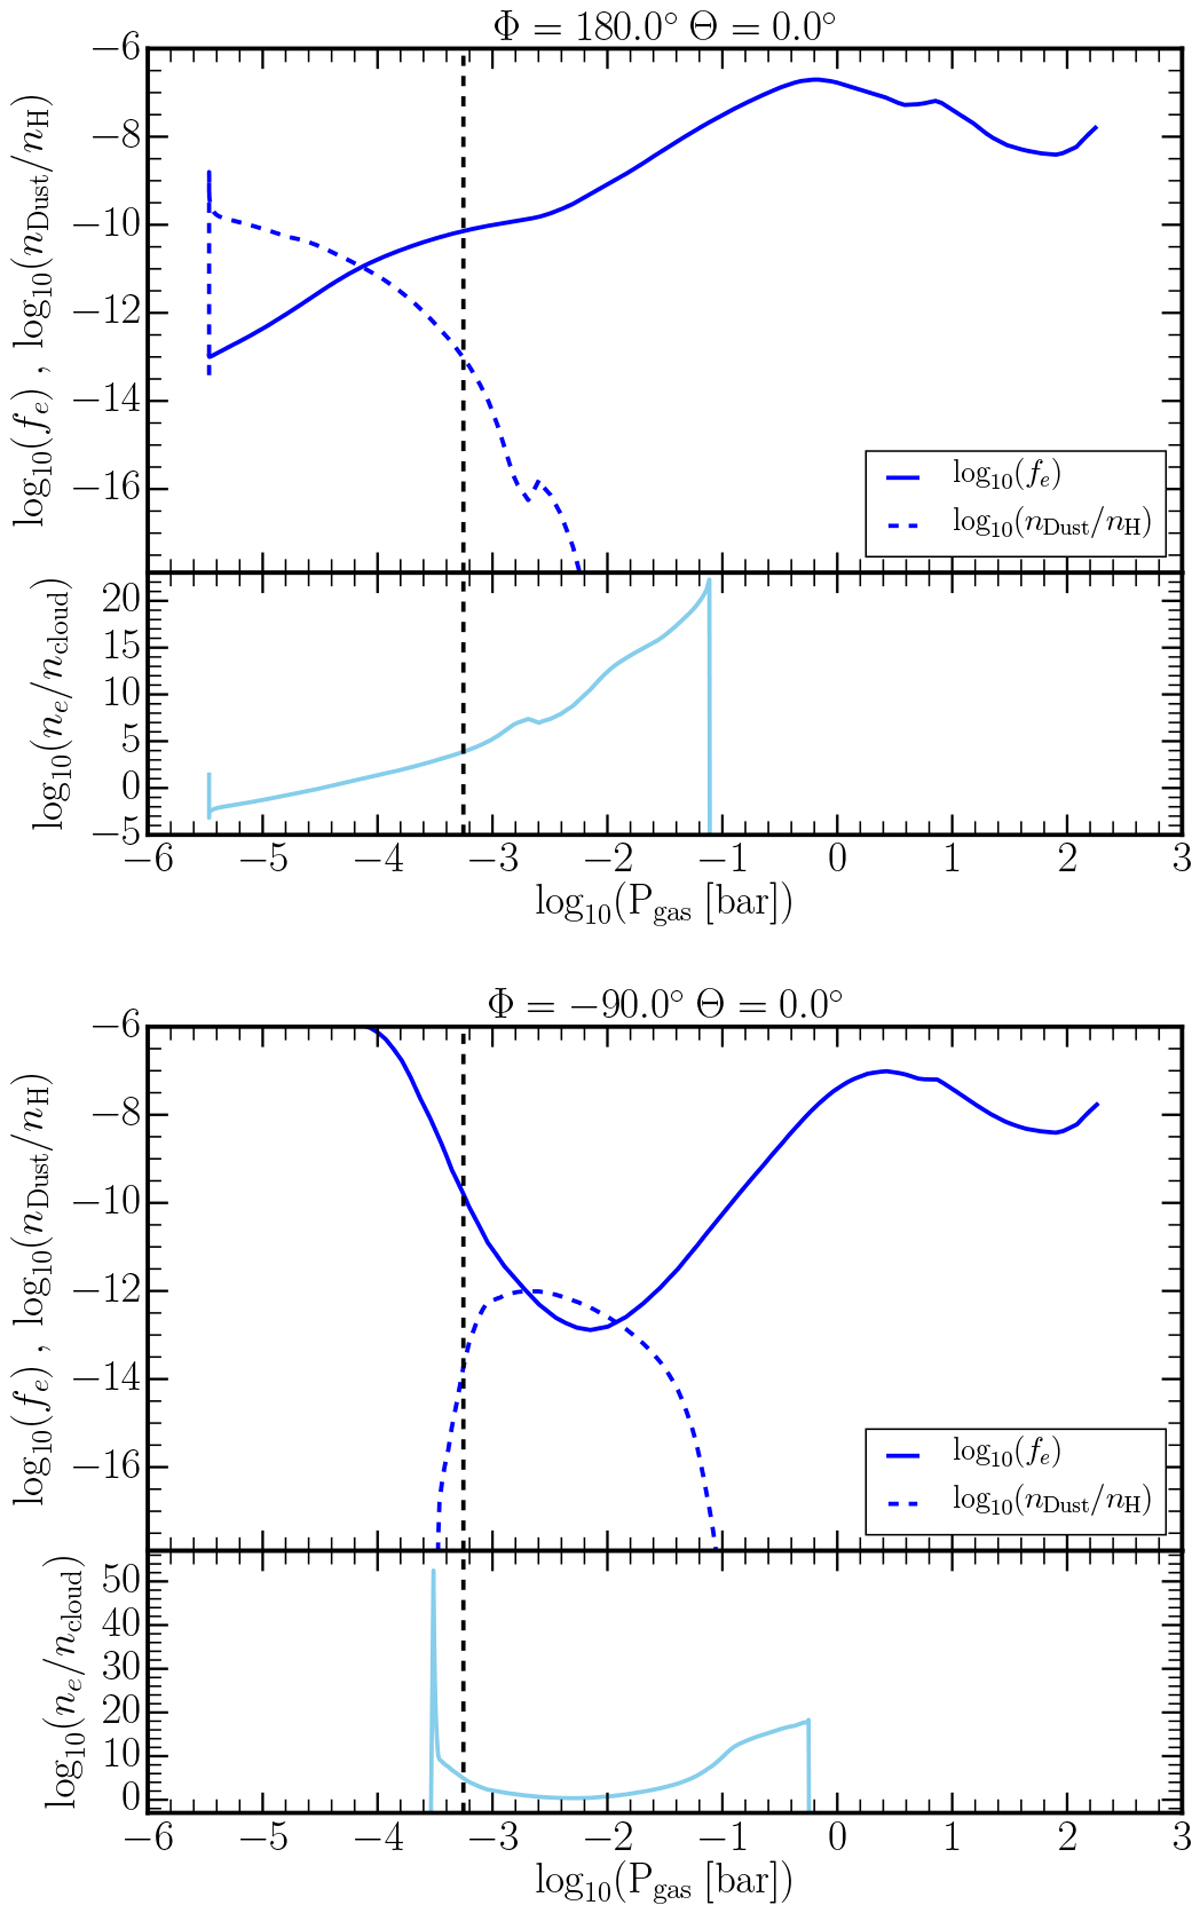
Possible discharges in the atmosphere of HAT-P7b on the nightside (top) and at the morning terminator (bottom). Top panels: degree of ionisation, fe, and the dust number density per hydrogen, nd∕nH. Bottom panels: ratio of electron number density, ne, to the number of cloud particles, nd. For ne ∕nd > 1, the atmosphere is in the electron dominated regime. The dotted vertical line represents pgas = 5.56 × 10⁻⁴ bar, the pressurelimit below which electric field breakdown may occur. To the left of this line, the clouds are susceptible to large-scale discharges.
Current usage metrics show cumulative count of Article Views (full-text article views including HTML views, PDF and ePub downloads, according to the available data) and Abstracts Views on Vision4Press platform.
Data correspond to usage on the plateform after 2015. The current usage metrics is available 48-96 hours after online publication and is updated daily on week days.
Initial download of the metrics may take a while.