Fig. 2
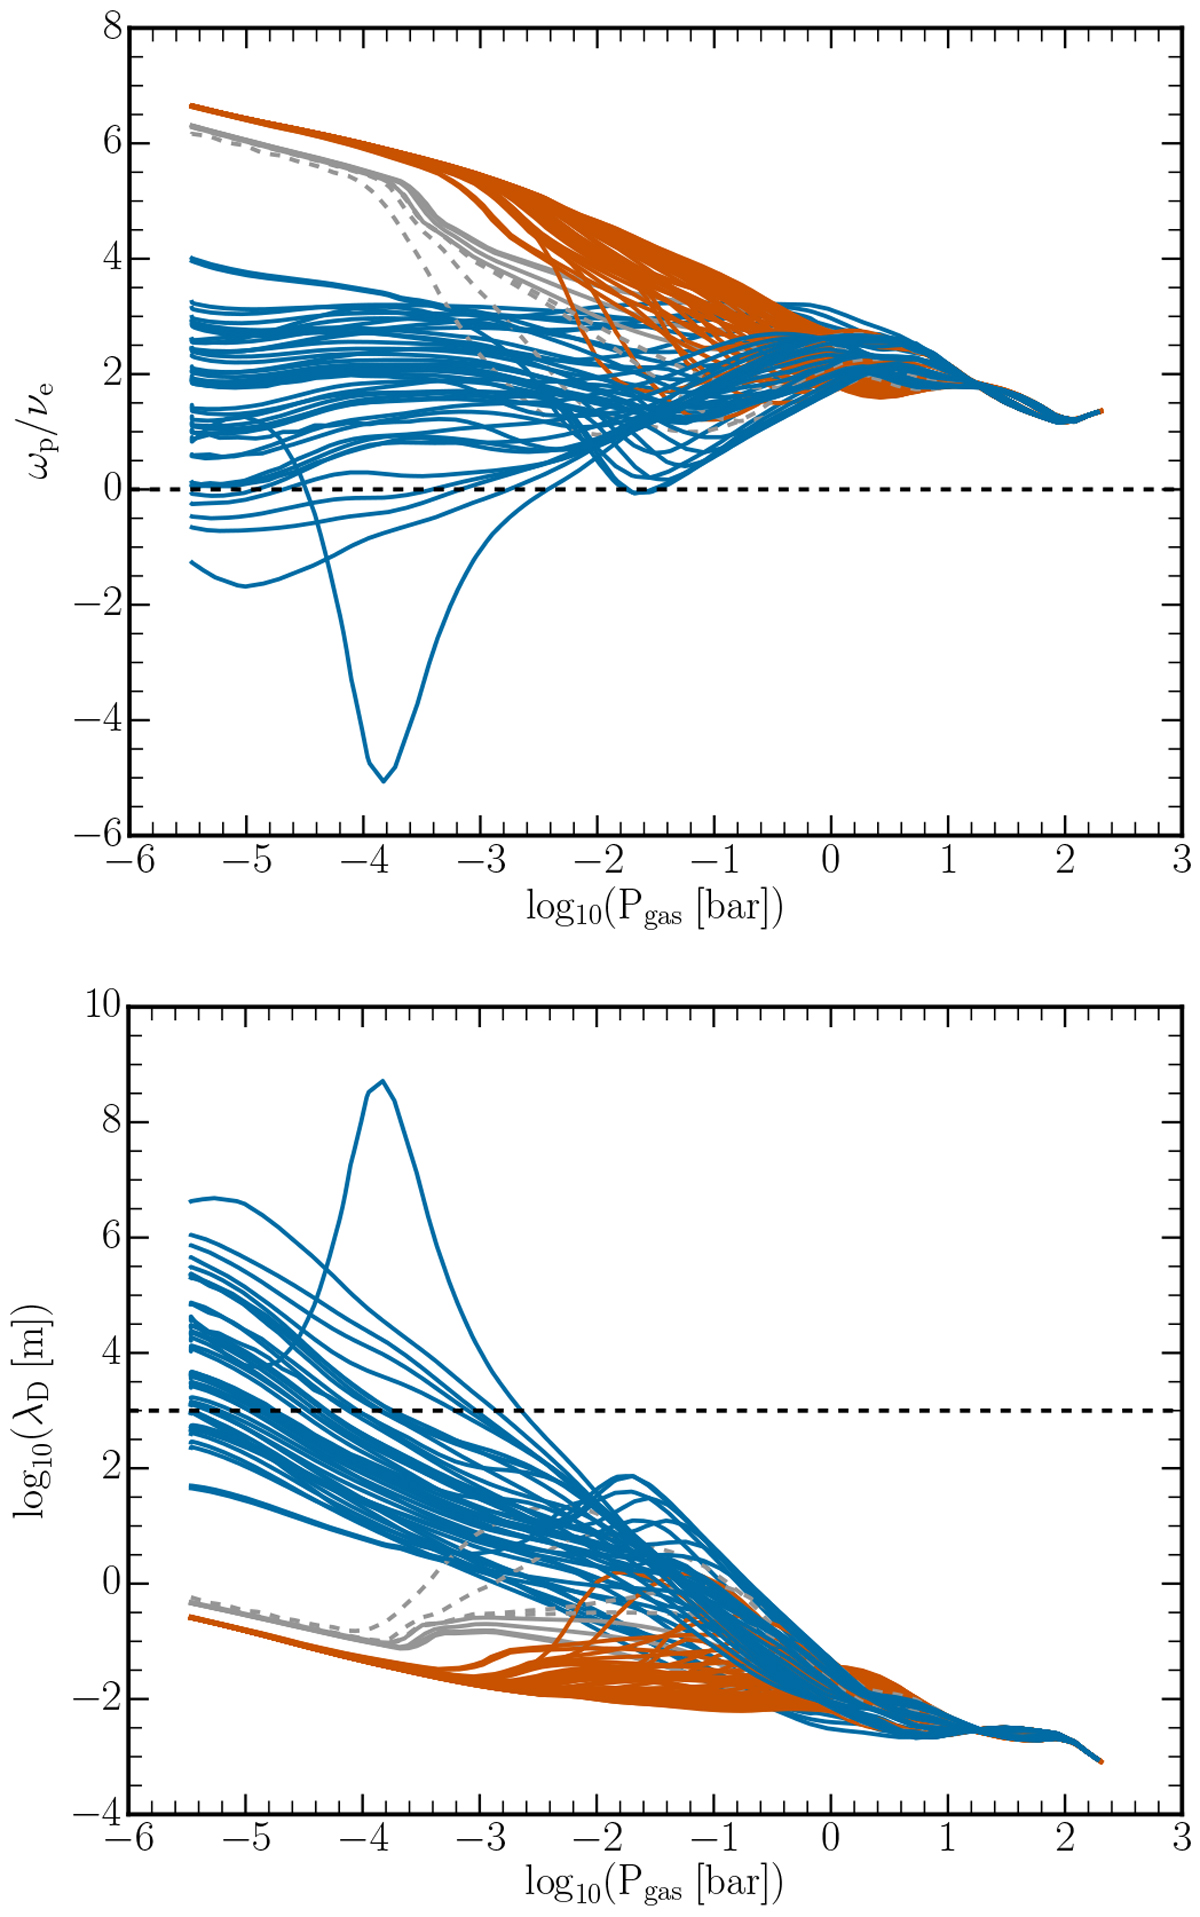
Ratio of plasma frequency of electrons to electron–neutral collisional frequency (top, ωpe ∕νne = 1 – black dashed line) and the Debye length, λD (bottom) of all 97 1D profiles. For length scales less than the Debye length, a test charge experiences the influence of a charge imbalance inside a Debye sphere. The horizontal black dashed line at L = 103 m represents the pressure scale height in the mid-atmosphere for comparison. The red lines correspond to the dayside (ϕ = 60.0°…0.0°…300.0°). The blue lines are the nightside profiles (ϕ = 120.0°…240.0°). The grey solid lines corresponds to the evening terminator profiles (ϕ = 90.0°). The grey dashed lines are the morning terminator profiles (ϕ = −90.0° or 270.0°)
Current usage metrics show cumulative count of Article Views (full-text article views including HTML views, PDF and ePub downloads, according to the available data) and Abstracts Views on Vision4Press platform.
Data correspond to usage on the plateform after 2015. The current usage metrics is available 48-96 hours after online publication and is updated daily on week days.
Initial download of the metrics may take a while.