Fig. 9.
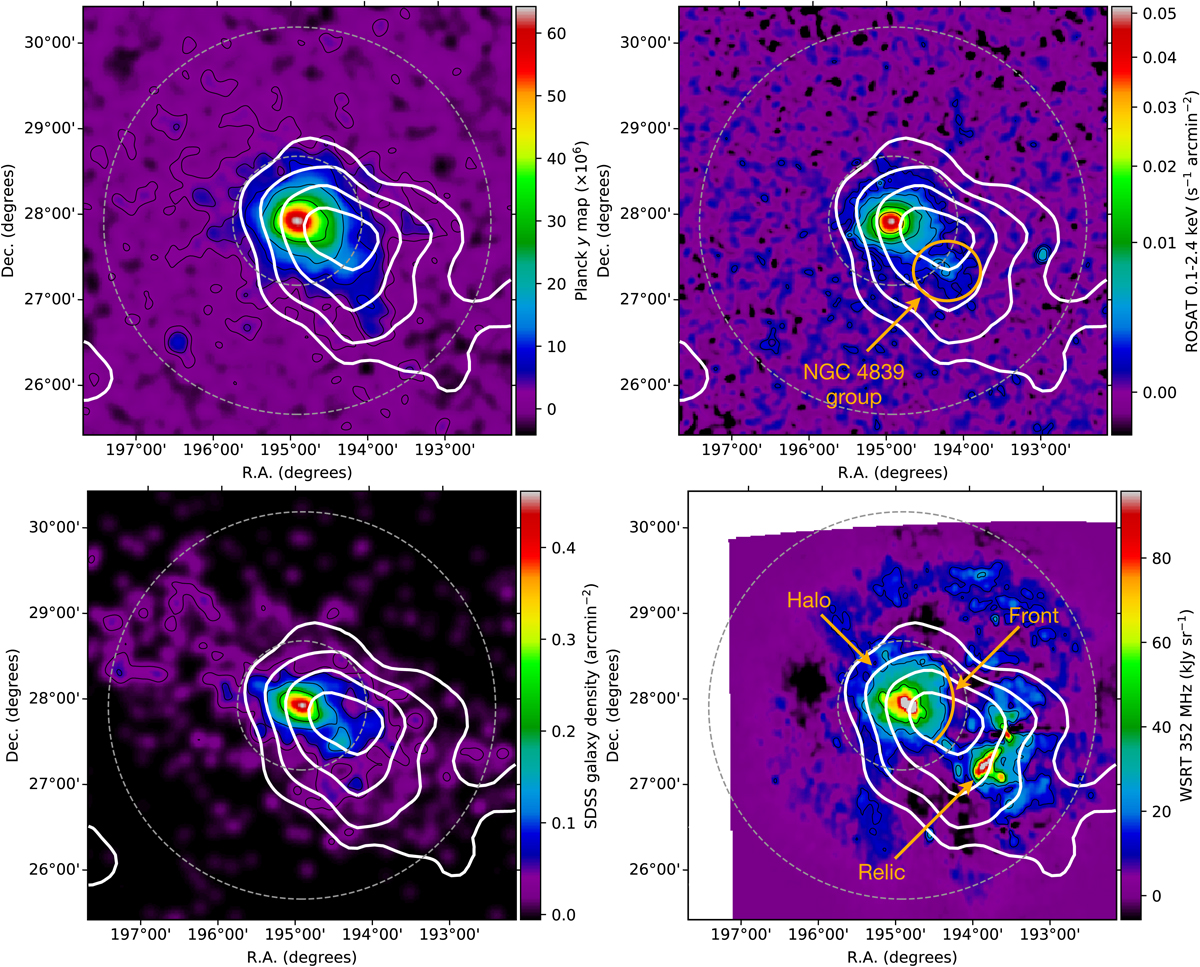
Multiwavelength morphological comparison of the Coma cluster signal to the Fermi-LAT TS map obtained in our baseline model. Top left: Planck tSZ. Top right: ROSAT X-ray. Bottom left: SDSS galaxy density. Bottom right: WSRT 352 MHz radio signal. The field of view of all images is 5 × 5 deg2. The white contours give the Fermi-LAT TS map (contours at 4, 9, 16, and 25) for the reference MINOT model (![]() ). For all panels, the black contours correspond to the maximum of the image divided by 2i, with i the index of the contours. The dashed gray circle provides the radius θ500 and 3 × θ500. Several relevant features are also indicated in orange. For display purposes, the WSRT image has been apodized at large radii to reduce the larger noise fluctuations present on the edge of the field. As a complementary figure, Fig. 8 provides an optical image of the central region.
). For all panels, the black contours correspond to the maximum of the image divided by 2i, with i the index of the contours. The dashed gray circle provides the radius θ500 and 3 × θ500. Several relevant features are also indicated in orange. For display purposes, the WSRT image has been apodized at large radii to reduce the larger noise fluctuations present on the edge of the field. As a complementary figure, Fig. 8 provides an optical image of the central region.
Current usage metrics show cumulative count of Article Views (full-text article views including HTML views, PDF and ePub downloads, according to the available data) and Abstracts Views on Vision4Press platform.
Data correspond to usage on the plateform after 2015. The current usage metrics is available 48-96 hours after online publication and is updated daily on week days.
Initial download of the metrics may take a while.