Open Access
Fig. 8.
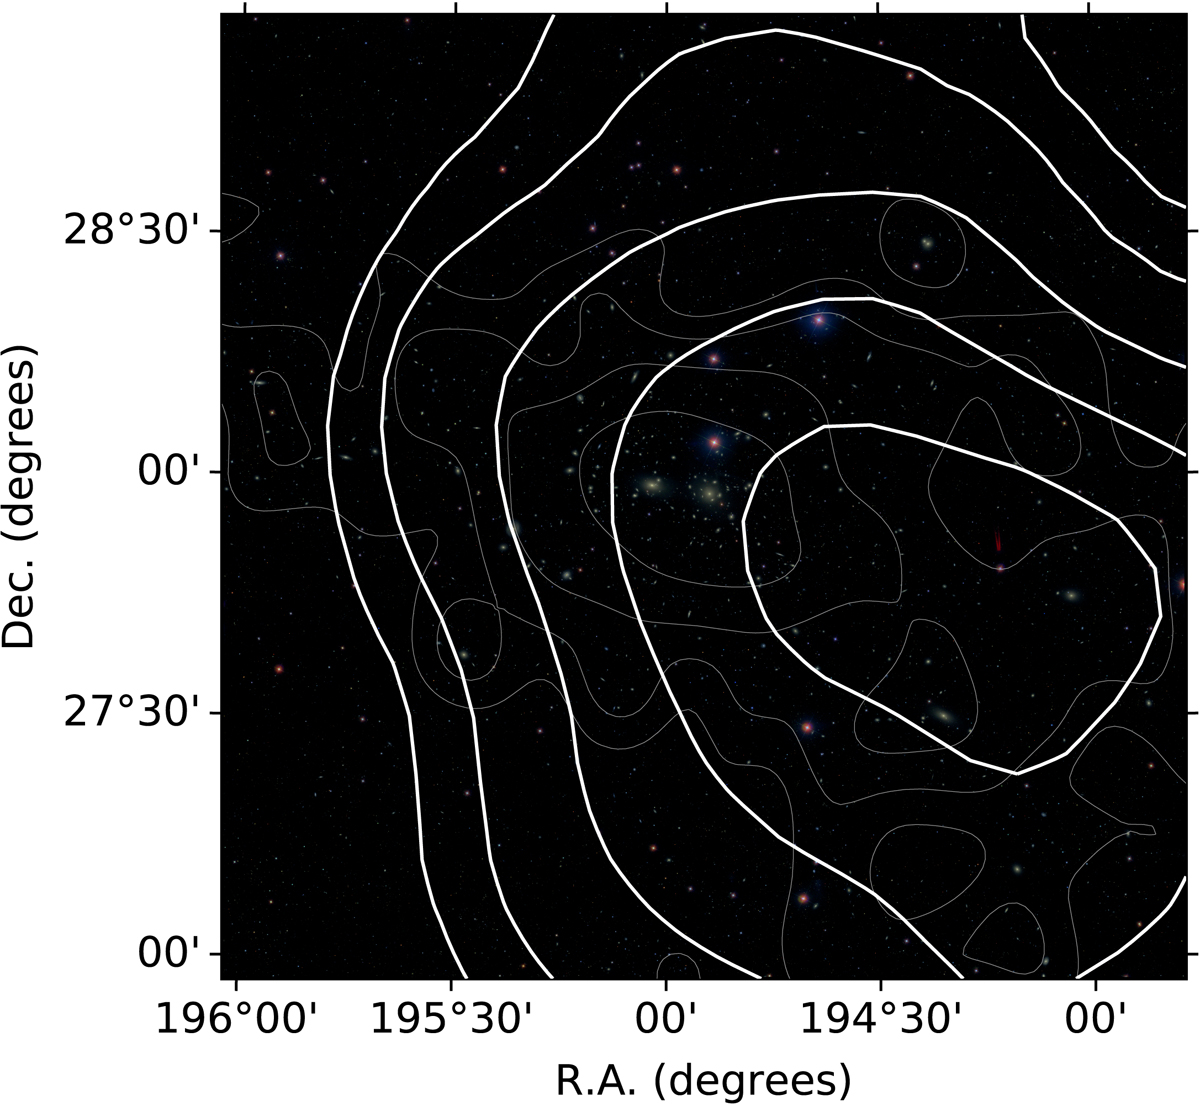
SDSS color image of the central 2 × 2 deg2 cluster region. The thin gray contours provide the galaxy density as shown in Fig. 9. The white contours give the TS map levels of 2, 4, 9, 16, and 25. The image was constructed using the g, r, and i filters of SDSS.
Current usage metrics show cumulative count of Article Views (full-text article views including HTML views, PDF and ePub downloads, according to the available data) and Abstracts Views on Vision4Press platform.
Data correspond to usage on the plateform after 2015. The current usage metrics is available 48-96 hours after online publication and is updated daily on week days.
Initial download of the metrics may take a while.