Open Access
Fig. 7.
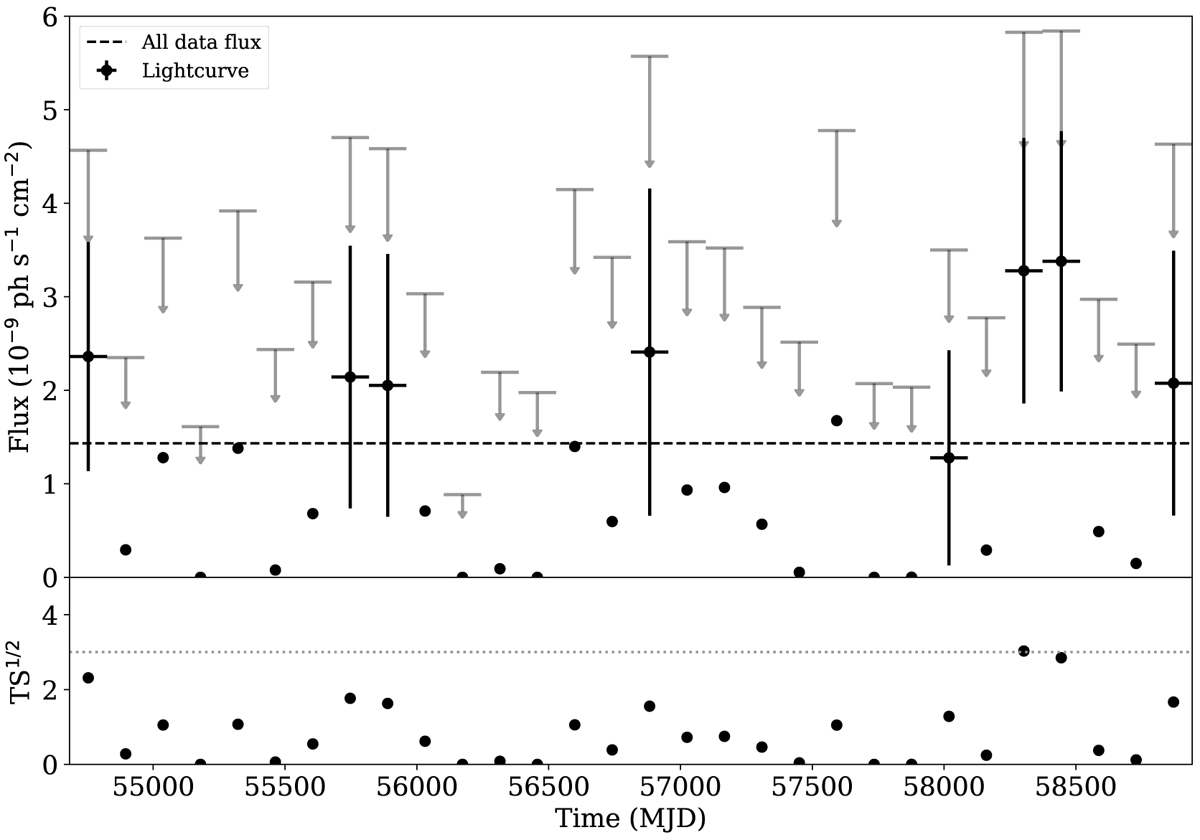
Light curve associated with the Coma cluster model fit, for the full dataset, in bins of about 4.5 months. For clarity, error bars are shown only for points that are mode than 1σ away from zero, and upper limits (95% confidence interval) are also given. Bottom panel: square root of the TS associated with the source.
Current usage metrics show cumulative count of Article Views (full-text article views including HTML views, PDF and ePub downloads, according to the available data) and Abstracts Views on Vision4Press platform.
Data correspond to usage on the plateform after 2015. The current usage metrics is available 48-96 hours after online publication and is updated daily on week days.
Initial download of the metrics may take a while.