Fig. 6.
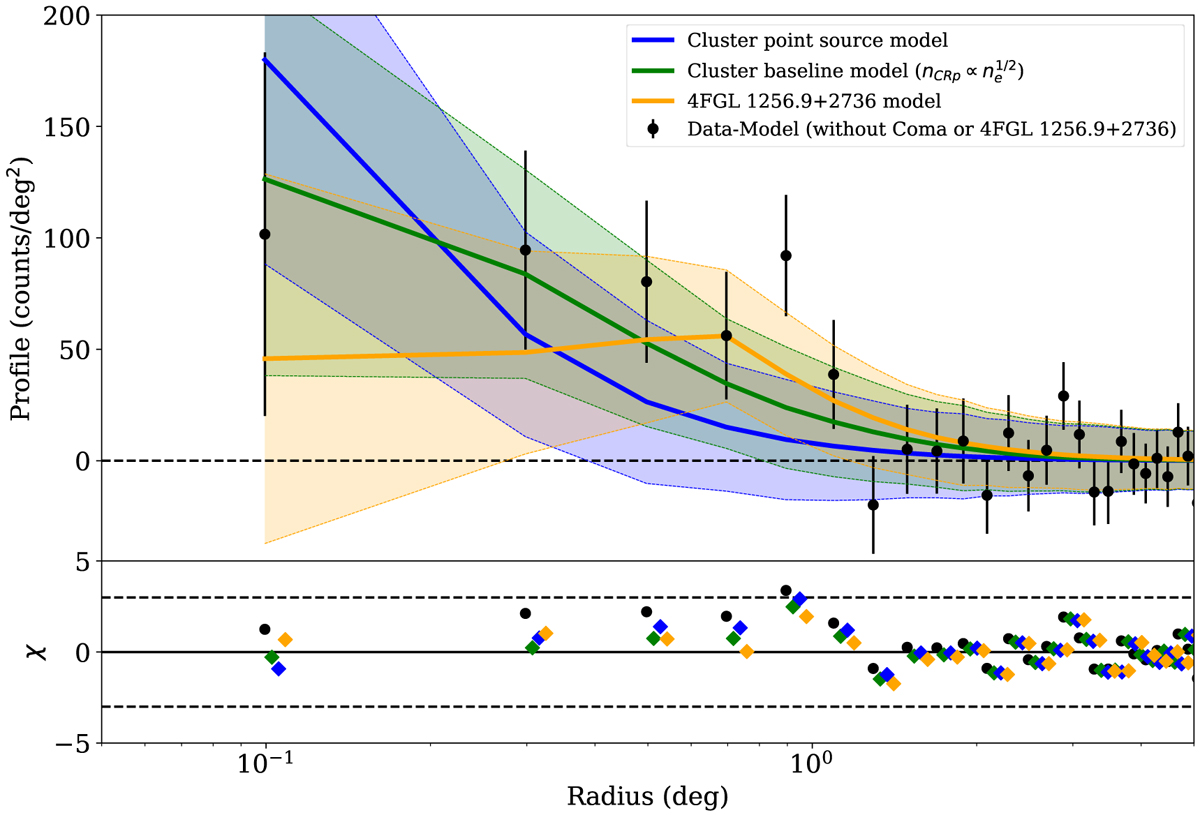
Radial profile of the Fermi-LAT excess count in the total energy band (200 MeV−300 GeV) for different models. The black data points give the excess count when both 4FGL J1256.9+2736 or a cluster model is excluded from the model. We show the best-fit model in the case of scenario 1 (4FGL J1256.9+2736 only, orange line) and in the case of scenario 2 (cluster diffuse model only; baseline in green and point source in blue). The shaded areas correspond to the expected Poisson uncertainties given the respective model. Bottom panel: residual normalized by the error bar with a similar color code.
Current usage metrics show cumulative count of Article Views (full-text article views including HTML views, PDF and ePub downloads, according to the available data) and Abstracts Views on Vision4Press platform.
Data correspond to usage on the plateform after 2015. The current usage metrics is available 48-96 hours after online publication and is updated daily on week days.
Initial download of the metrics may take a while.