Fig. 5.
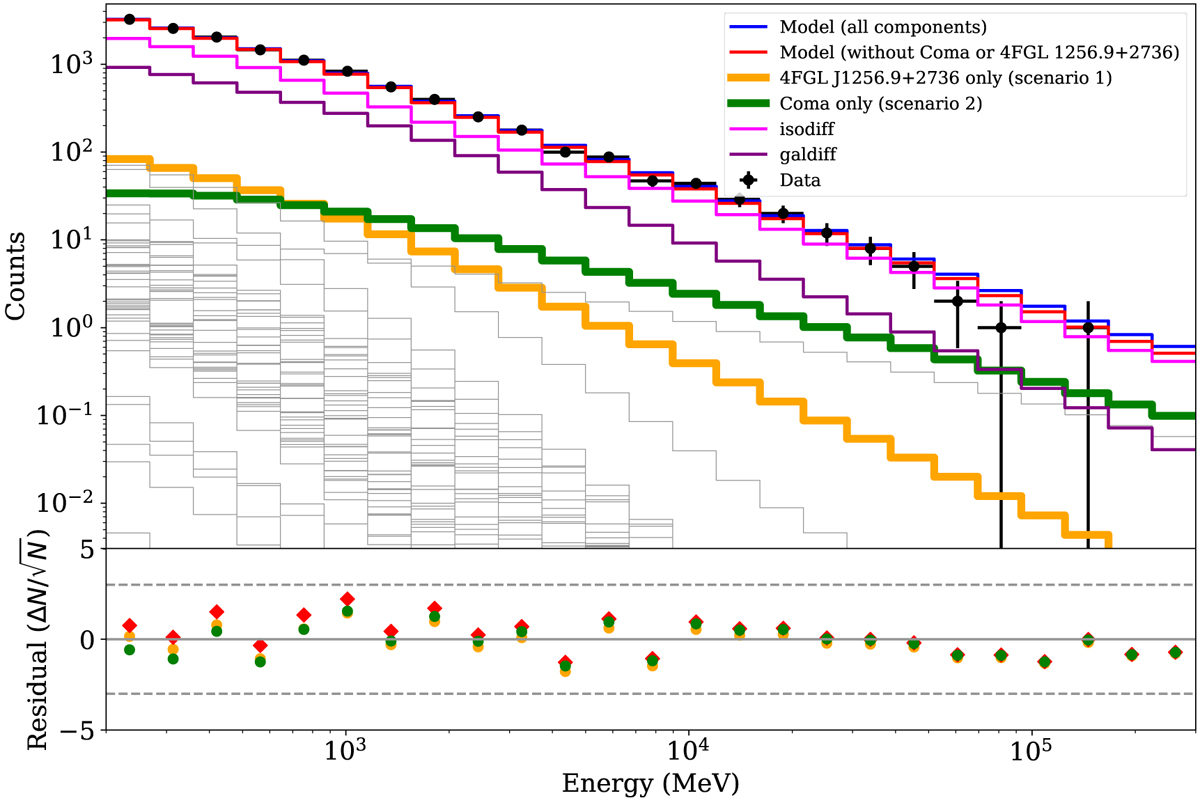
Fermi-LAT counts as a function of energy, computed within 3θ500 from the Coma center. The blue line shows the total model in the case of scenario 2 (but it is not distinguishable from scenario 1 in this figure), the red line shows the model when excluding the Coma cluster diffuse emission or 4FGL J1256.9+2736, the orange line show the contribution from 4FGL J1256.9+2736 in the case of scenario 1, and the green line show the Coma cluster diffuse contribution in the case of scenario 2. The contribution from the different sources in the ROI is also indicated as gray lines, except for the isotropic and diffuse backgrounds, given in magenta and purple, respectively. Bottom panel: residual between the data and the model, in red when both the Coma cluster diffuse emission or 4FGL J1256.9+2736 are excluded from the model, in orange in the case of scenario 1 and in green in the case of scenario 2.
Current usage metrics show cumulative count of Article Views (full-text article views including HTML views, PDF and ePub downloads, according to the available data) and Abstracts Views on Vision4Press platform.
Data correspond to usage on the plateform after 2015. The current usage metrics is available 48-96 hours after online publication and is updated daily on week days.
Initial download of the metrics may take a while.