Fig. 4.
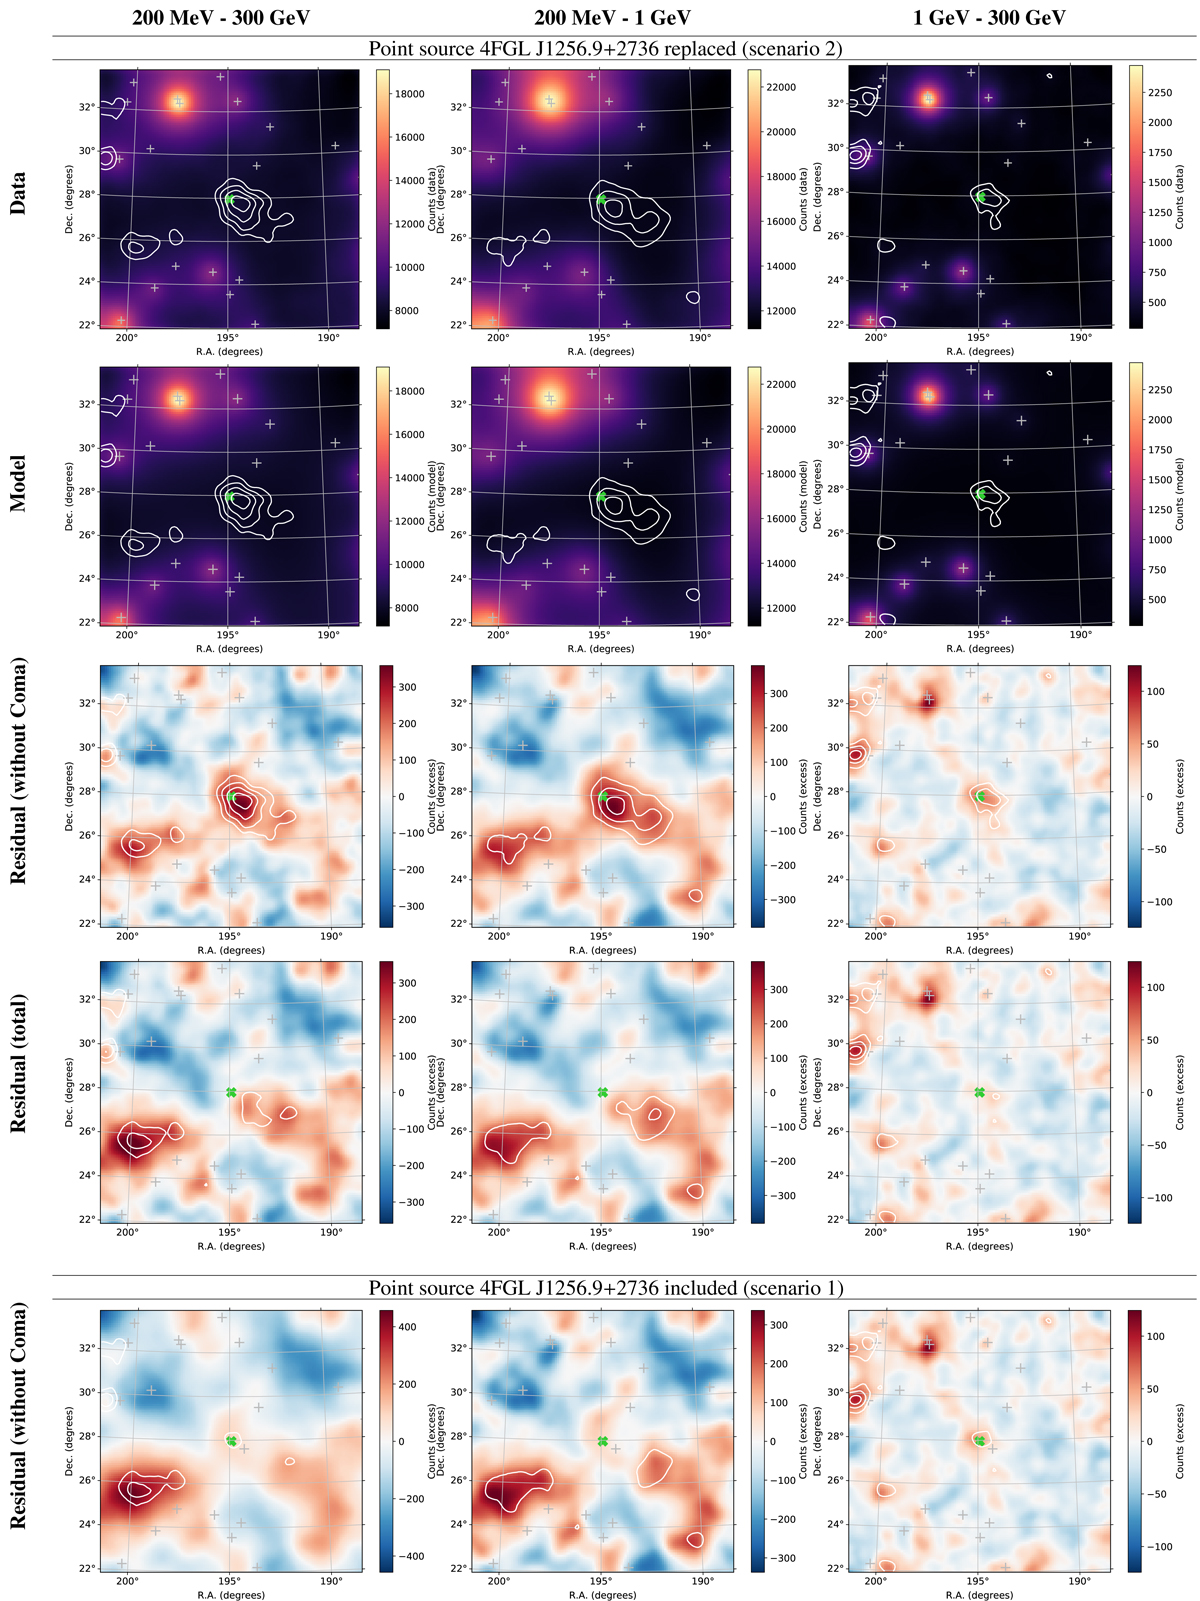
Fermi-LAT imaging centered on Coma and comparison to the model (baseline model, ![]() ). We show the Fermi-LAT data (first row), the best-fit model (second row), the residual excluding the cluster model (third row), and the residual with respect to the total model (fourth row). We also show the residual excluding the cluster when accounting for 4FGL J1256.9+2736 (fifth row). Left, middle and right columns: total (200 MeV−300 GeV), low (200 MeV−1 GeV), and high (1 GeV−300 GeV) energy range, respectively. The white contours correspond to TS = [4, 9, 16, 25]. The gray crosses provide the location of the 4FGL sources and the green cross the Coma center.
). We show the Fermi-LAT data (first row), the best-fit model (second row), the residual excluding the cluster model (third row), and the residual with respect to the total model (fourth row). We also show the residual excluding the cluster when accounting for 4FGL J1256.9+2736 (fifth row). Left, middle and right columns: total (200 MeV−300 GeV), low (200 MeV−1 GeV), and high (1 GeV−300 GeV) energy range, respectively. The white contours correspond to TS = [4, 9, 16, 25]. The gray crosses provide the location of the 4FGL sources and the green cross the Coma center.
Current usage metrics show cumulative count of Article Views (full-text article views including HTML views, PDF and ePub downloads, according to the available data) and Abstracts Views on Vision4Press platform.
Data correspond to usage on the plateform after 2015. The current usage metrics is available 48-96 hours after online publication and is updated daily on week days.
Initial download of the metrics may take a while.