Fig. 2.
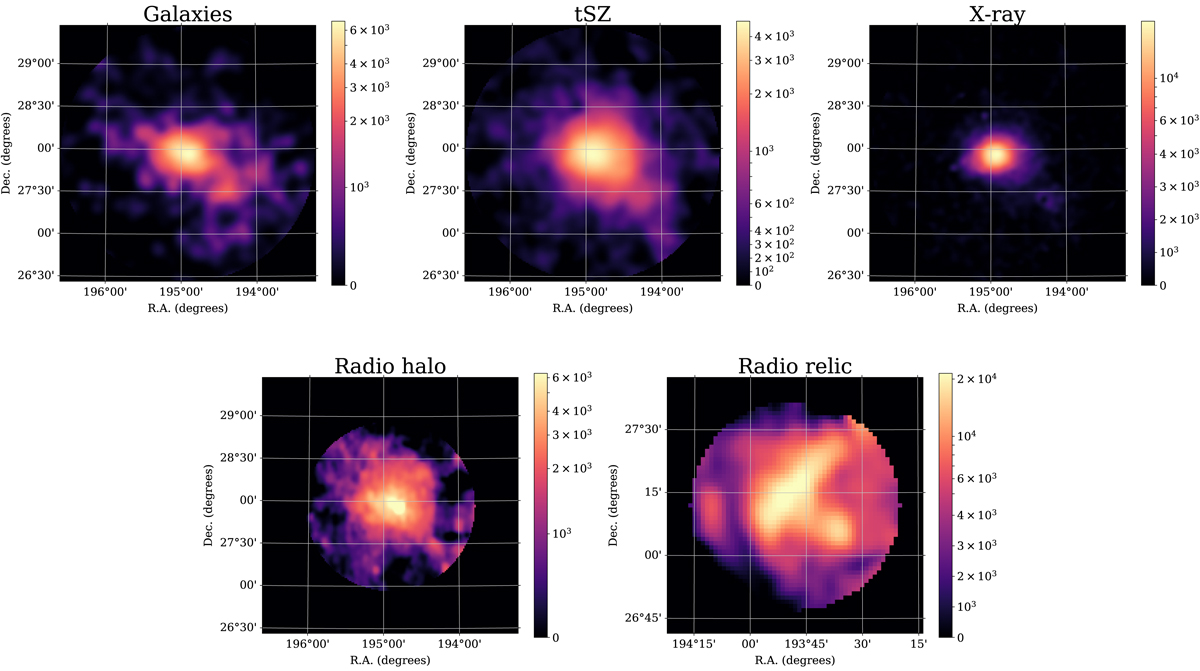
Template images used to describe the morphology of the γ-ray emission. From left to right and top to bottom: templates based on the distribution of galaxies, the tSZ signal, the X-ray emission, the radio halo emission, and the radio relic emission. Images are 3 × 3 deg2, except for the radio relic (bottom right), which is only 1 × 1 deg2. Units are arbitrary, but the integral of all maps over the solid angle is set to unity. For display purpose, the scale is linear from zero to 20% of the peak value, and logarithmic above.
Current usage metrics show cumulative count of Article Views (full-text article views including HTML views, PDF and ePub downloads, according to the available data) and Abstracts Views on Vision4Press platform.
Data correspond to usage on the plateform after 2015. The current usage metrics is available 48-96 hours after online publication and is updated daily on week days.
Initial download of the metrics may take a while.