Fig. B.1.
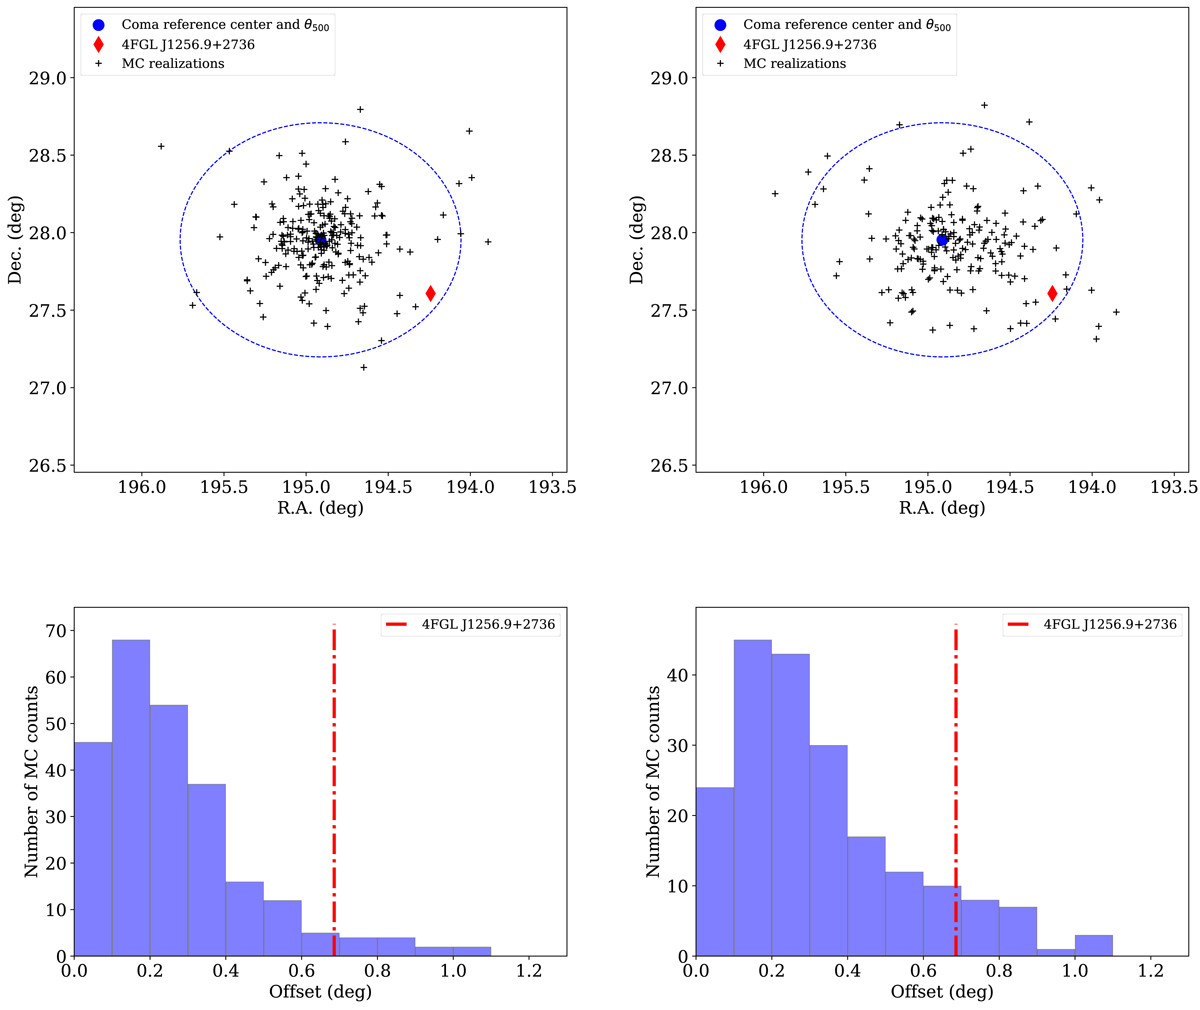
Top: sky distribution of the test source coordinates recovered for each Monte Carlo realization and comparison to the Coma reference center and the 4FGL J1256.9+2736 location. Bottom: distribution of the offset from the Coma reference center of the Monte Carlo realizations. Left panels: extended ICM model and right panel: tSZ template model.
Current usage metrics show cumulative count of Article Views (full-text article views including HTML views, PDF and ePub downloads, according to the available data) and Abstracts Views on Vision4Press platform.
Data correspond to usage on the plateform after 2015. The current usage metrics is available 48-96 hours after online publication and is updated daily on week days.
Initial download of the metrics may take a while.