Open Access
Fig. A.1.
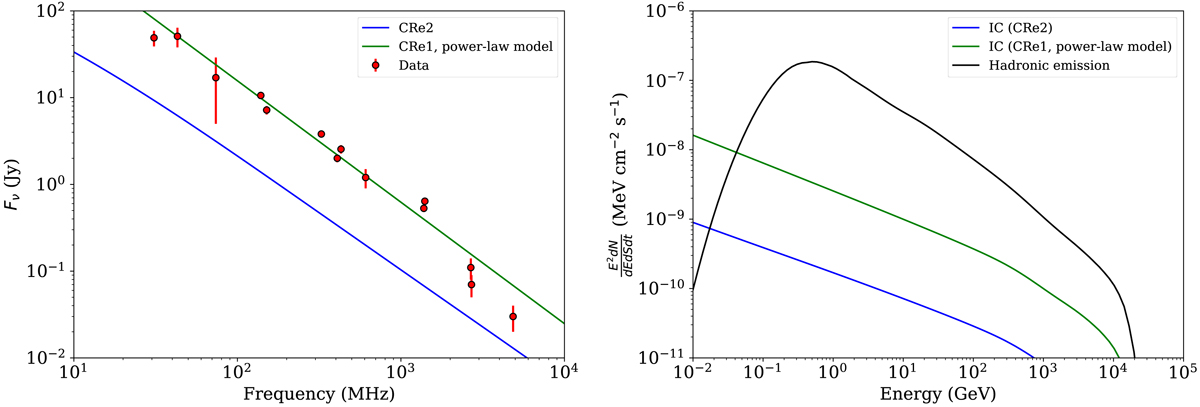
Estimation of the inverse Compton emission to the γ-ray signal. Left: radio synchrotron spectrum data to which the CRe population can be matched. Right: associated emission in the γ-ray energy range.
Current usage metrics show cumulative count of Article Views (full-text article views including HTML views, PDF and ePub downloads, according to the available data) and Abstracts Views on Vision4Press platform.
Data correspond to usage on the plateform after 2015. The current usage metrics is available 48-96 hours after online publication and is updated daily on week days.
Initial download of the metrics may take a while.