Fig. 14.
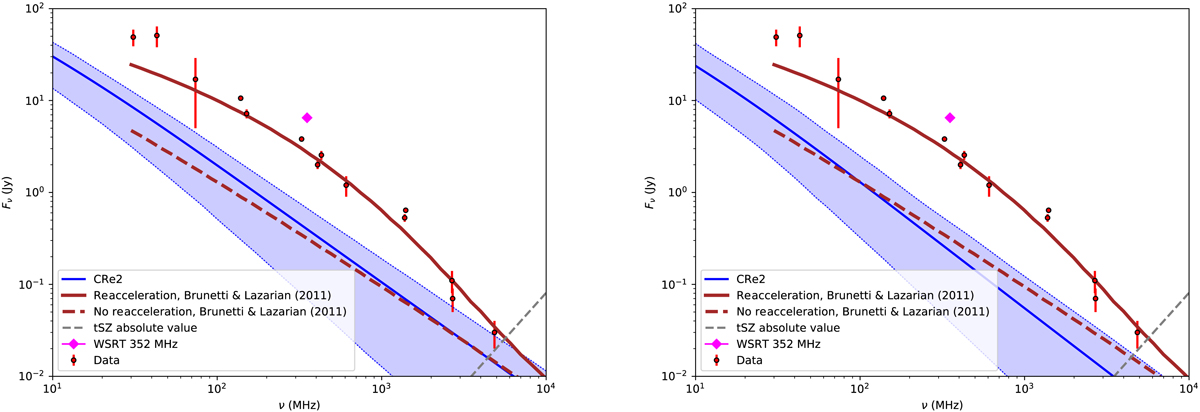
Comparison between the CRe2 induced synchrotron spectrum to the reacceleration model developed by Brunetti & Lazarian (2011), in the case of a flat CRp population. The solid brown line corresponds to the full reacceleration model, while the dashed brown line corresponds to the case where reacceleration is switched off (see Brunetti & Lazarian 2011, for more details). Left: replacing 4FGL J1256.9+2736 by the cluster diffuse component (scenario 2). Right: including both 4FGL J1256.9+2736 and the cluster diffuse component in the sky model (scenario 3).
Current usage metrics show cumulative count of Article Views (full-text article views including HTML views, PDF and ePub downloads, according to the available data) and Abstracts Views on Vision4Press platform.
Data correspond to usage on the plateform after 2015. The current usage metrics is available 48-96 hours after online publication and is updated daily on week days.
Initial download of the metrics may take a while.