Fig. 12.
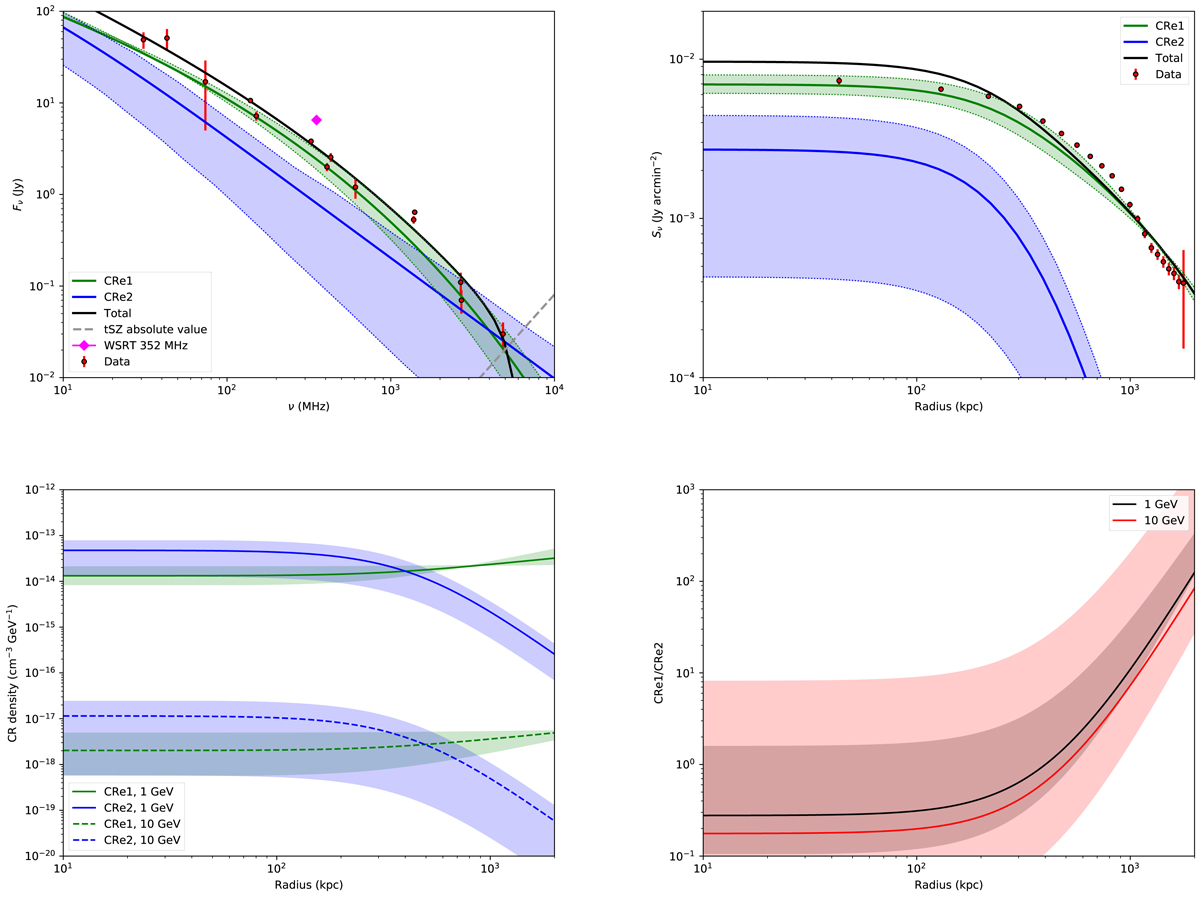
Constraint on the CRe populations in the case of scenario 1 (distinct CRe1 and CRe2 populations, no reacceleration). Top left: radio spectrum of Coma, as compiled from Pizzo (2010) and constraint from the reference CRp spatial model (![]() ) and the reference CRe1 spectral model (ExponentialCutoffPowerLaw). The measurement from the Brown & Rudnick (2011) data is also shown as the magenta diamond. The contribution from the CRe2 is shown in blue together with its 68% confidence interval, and the remaining contribution from CRe1 is shown in green. The sum of the two is given as the black line. The dashed gray line provide the expected amplitude of the tSZ signal. All fluxes are computed using cylindrical integration within R = 0.48 × R500 = 629 kpc ≡ 0.36 deg. Top right: radio profile measured from the WSRT map at 352 GHz and comparison to the reference model. The contributions from CRe2 and CRe1 are as in the left panel. Bottom left: absolute number density distributions of CRe1 and CRe2 taken at 1 GeV and 10 GeV. Bottom right: ratio between the CRe1 and CRe2 number populations. We note that in the case of this figure, the confidence limits where computed using a resampling of only 100 parameters, and are thus not very accurate. We also stress that this figure depends on the magnetic field modeling (see Sect. 7.2 for discussions).
) and the reference CRe1 spectral model (ExponentialCutoffPowerLaw). The measurement from the Brown & Rudnick (2011) data is also shown as the magenta diamond. The contribution from the CRe2 is shown in blue together with its 68% confidence interval, and the remaining contribution from CRe1 is shown in green. The sum of the two is given as the black line. The dashed gray line provide the expected amplitude of the tSZ signal. All fluxes are computed using cylindrical integration within R = 0.48 × R500 = 629 kpc ≡ 0.36 deg. Top right: radio profile measured from the WSRT map at 352 GHz and comparison to the reference model. The contributions from CRe2 and CRe1 are as in the left panel. Bottom left: absolute number density distributions of CRe1 and CRe2 taken at 1 GeV and 10 GeV. Bottom right: ratio between the CRe1 and CRe2 number populations. We note that in the case of this figure, the confidence limits where computed using a resampling of only 100 parameters, and are thus not very accurate. We also stress that this figure depends on the magnetic field modeling (see Sect. 7.2 for discussions).
Current usage metrics show cumulative count of Article Views (full-text article views including HTML views, PDF and ePub downloads, according to the available data) and Abstracts Views on Vision4Press platform.
Data correspond to usage on the plateform after 2015. The current usage metrics is available 48-96 hours after online publication and is updated daily on week days.
Initial download of the metrics may take a while.