Fig. 10.
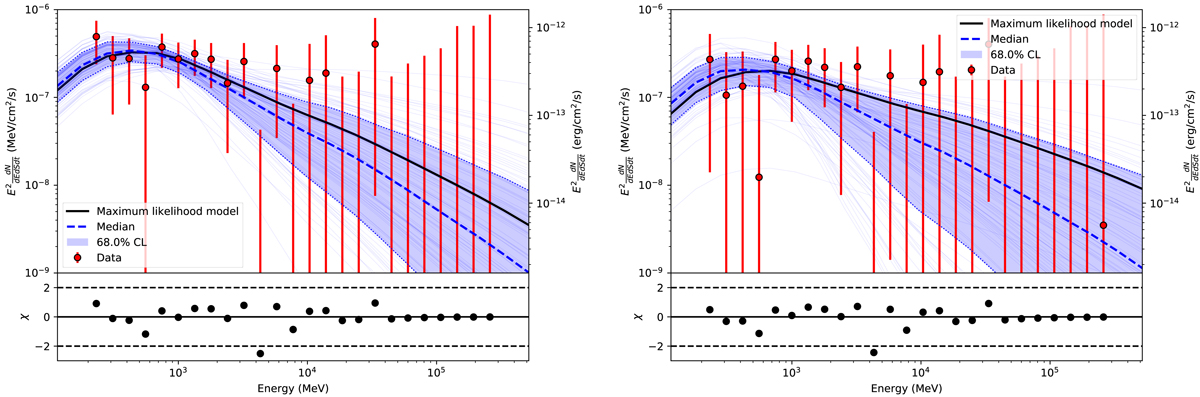
Total SED recovered from the Fermi-LAT and MCMC constraint in the case of the reference model (![]() ) when 4FGL J1256.9+2736 is replaced by the ICM component in the sky model (left) or both are included (right). The best-fit model is shown in black and the 68% confidence interval is show in blue, together with 100 models randomly sampled from the MCMC parameter chains. The median of these models is also shown as a dashed blue line. The residual provides the difference between the data and the best-fit model normalized by the error bars.
) when 4FGL J1256.9+2736 is replaced by the ICM component in the sky model (left) or both are included (right). The best-fit model is shown in black and the 68% confidence interval is show in blue, together with 100 models randomly sampled from the MCMC parameter chains. The median of these models is also shown as a dashed blue line. The residual provides the difference between the data and the best-fit model normalized by the error bars.
Current usage metrics show cumulative count of Article Views (full-text article views including HTML views, PDF and ePub downloads, according to the available data) and Abstracts Views on Vision4Press platform.
Data correspond to usage on the plateform after 2015. The current usage metrics is available 48-96 hours after online publication and is updated daily on week days.
Initial download of the metrics may take a while.